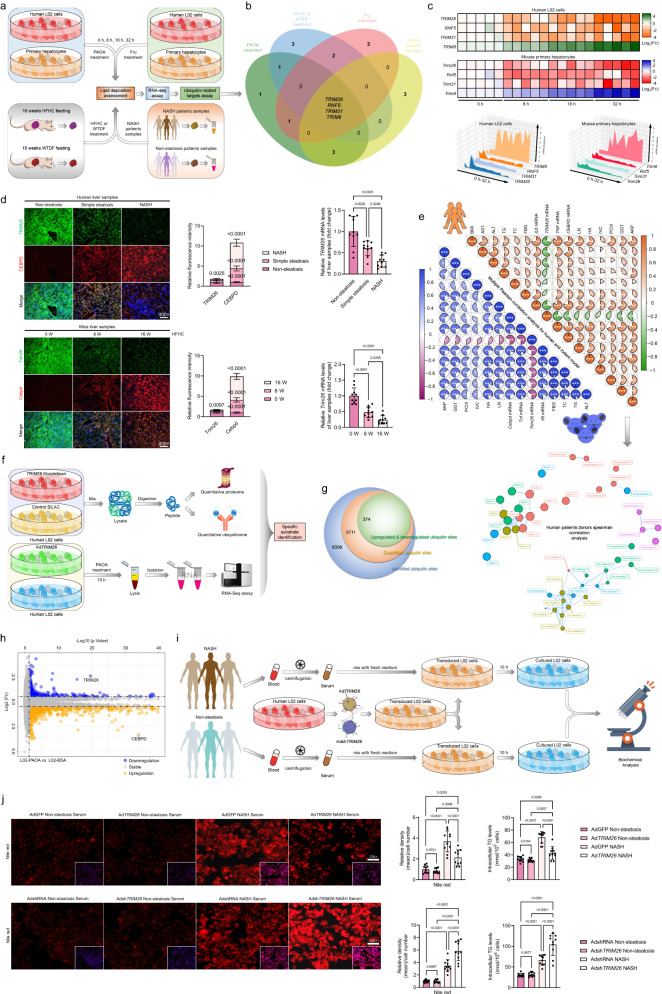
Fig. 1. TRIM26 expression is downregulated in fatty liver.
a Experimental design showing the protocol of identifying ubiquitin-related targets in response to a time-course of 0.5 mM palmitate+1.0 mM oleic acid (PAOA), 5 mM fructose (Fru) in indicated groups. b Venn diagram showing the Top 4 distinguishable expressed ubiquitin-related ligases candidates in intersection of indicated groups. c Heatmaps determining the 4 distinguishable expressed ubiquitin-related ligases indicators in human L02 cells and primary hepatocytes with PAOA treatment for 0–32 h. d Representative immunofluorescence images of Tripartite motif containing 26 (TRIM26) and CCAAT/enhancer binding protein delta (C/EBPD) co-expression in lives samples with fluorescence intensity evaluation (scale bars: magnification, ×400, n = 10 samples) and (high-fat+high-cholesterol) HFHC-fed mice, and corresponding liver TRIM26 mRNA expression profiles (n = 10 samples per group) (P < 0.0001 by one-way ANOVA). e Multiple Pearson multiple correlation analysis for human subjects and rodent model (upper), and human patients donors network Spearman correlation analysis (lower) exhibiting the comprehensive correlation between TRIM26 mRNA expression and indicated parameter indexes (n = 49 indices per parameter). f The flowchart showing the experimental procedure for the quantified ubiquitome, transcriptome and protein interaction assay of TRIM26. g Number of identified ubiquitin sites, upregulated & downregulated ubiquitin sites. h Volcano plot showing genes expression variation in L02 cells after PAOA treatment. Average protein expression ratio of 3 replicates (log 2 transformed) between PAOA- or BSA-induced L02 cells was plotted against p-value by Student’ s t test (−log 10 transformed). Cutoff of P < 0.05 and 1.2-fold change were marked by black dotted lines, respectively. The figure shows the total number of proteins identified as well as the number of up- and downregulated proteins. i A schematic diagram showing the human L02 cells were transfected with adenovirus (AdTRIM26) or (AdshTRIM26) for 24 h and then treated with the NASH serum- or Non-steatosis serum-mixed medium for 10 h. j Representative images and intracellular triglyceride (TG) analysis of the Nile red staining of L02 cells in indicated groups (scale bars: magnification, 200×; n = 10 images per group; P < 0.05 by one-way ANOVA). Data are expressed as mean ± SEM. The relevant experiments presented in this part were performed independently at least three times. P < 0.05 indicates statistical significance.

