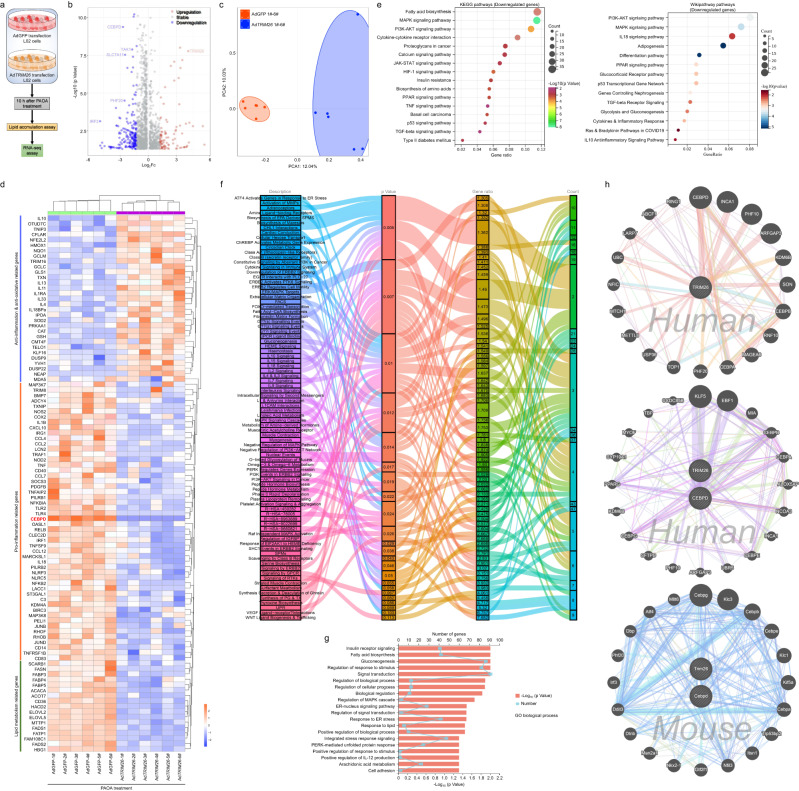
Fig. 2. Identification of CEBPD as a target of TRIM26.
a Schematic of the experimental procedure showing the genes expression in L02 cells after adenovirus-mediated TRIM26 overactivation (AdTRIM26). b–g Volcano plot; average protein expression ratio of 3 replicates (log 2 transformed) between 0.5 mM palmitate+1.0 mM oleic acid (PAOA)-induced AdGFP- or AdTRIM26-transfected L02 cells was plotted against p-value by Student’ s t test (−log 10 transformed). Cutoff of P < 0.05 and 1.2-fold change were marked by black dotted lines, respectively. The figure shows the total number of proteins identified as well as the number of up- and downregulated proteins (b), principal component analysis (PCA) analysis (c), heatmap (d), KEGG pathway & wiki-pathway analysis (e), Sankey diagram enrichment (f) and GO biological process analysis; data was plotted against p-value by Student’ s t test (−log 10 transformed) with cutoff of P < 0.05 and 1.2-fold change (g) in AdGFP-transfected or AdTRIM26-transfected L02 cells with PAOA co-treatment showing that TRIM26 affects lipid metabolism and inflammatory responses. h Circle diagram analysed by GeneMANIA further showing TRIM26-CEBPD protein interaction network in Homo sapiens and Mus musculus.

