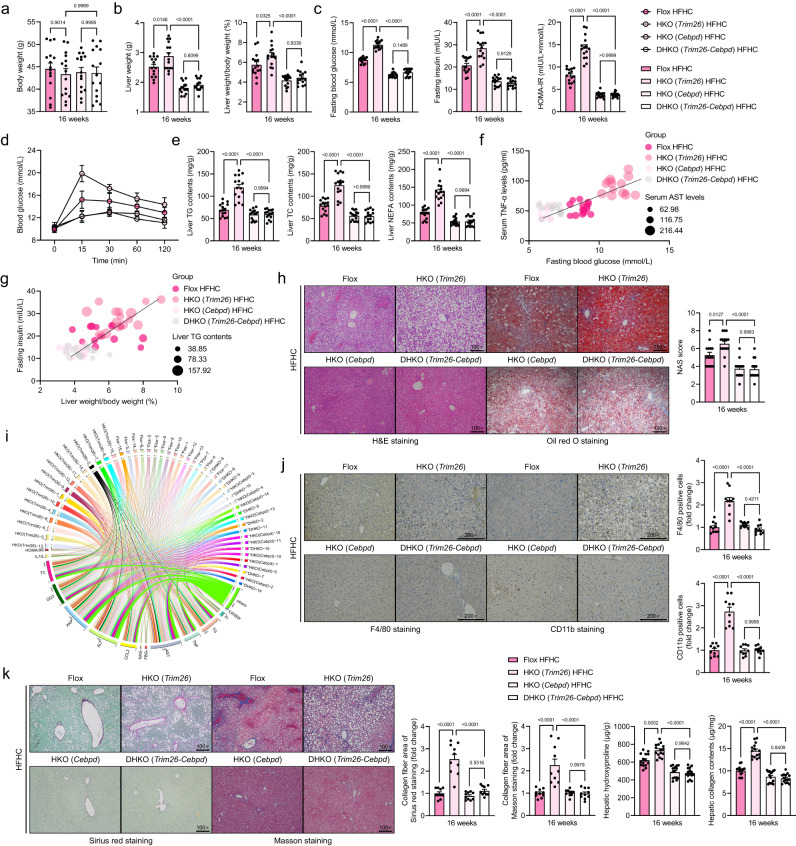
Fig. 5. Cebpd signalling is required for the protective function of Trim26 against NASH diet-induced steatohepatitis.
a–d Records for the body weight (a), liver weight and the ratio of liver weight/body weight (%) (LW/BW) (P < 0.0001 by one-way ANOVA) (b), fasting blood glucose levels, fasting insulin levels, fasting insulin levels and homoeostasis model assessment of insulin resistance (HOMA-IR) index (P < 0.0001 by one-way ANOVA) (c) and glucose tolerance test (GTT) analysis (P < 0.0001 by one-way ANOVA) (d) of the HFHC-fed HKO (Trim26) mice, hepatocyte-specific Cebpd deletion-HKO (Cebpd) mice, hepatocyte-specific Trim26 and Cebpd double knockout-DHKO (Trim26-Cebpd) mice and Flox mice (n = 15 mice per group). e Liver lipid contents including triglyceride (TG) (P < 0.0001 by one-way ANOVA), total cholesterol (TC) (P < 0.0001 by 2 tailed t test) and non-esterified fatty acid (NEFA) (P < 0.0001 by one-way ANOVA) in the indicated group (n = 15 mice per group). f, g Pearson correlation analyses showing the correlations between serum tumour necrosis factor (TNF-α) levels and fasting blood glucose (f), and fasting insulin and ratio of liver weight/body weight (%) (g) in HKO (Trim26) HFHC, HKO (Cebpd) HFHC, DHKO (Trim26-Cebpd) HFHC and Flox HFHC group. P < 0.01 for all of these correlations (n = 15 per parameter; n = 45 in total; P < 0.0001 by one-way ANOVA). h Representative pictures of H&E staining, oil red O staining and NAS score (P < 0.0001 by one-way ANOVA) in indicated group (scale bars: magnification, 100×; n = 15 images per group for each staining). i Circle correlation analysis showing the correlation between a series of indicators in HKO (Trim26) HFHC, HKO (Cebpd) HFHC, DHKO (Trim26-Cebpd) HFHC and Flox HFHC group. j, k Representative pictures of immunohistochemical analysis of F4/80 (P < 0.0001 by one-way ANOVA) and CD11b (P < 0.0001 by one-way ANOVA) (scale bars: magnification, ×200; n = 15 images per group for each staining) (j) and sirius red (P < 0.0001 by one-way ANOVA) & masson staining (P < 0.0001 by one-way ANOVA) (scale bars: magnification, ×100; n = 15 images per group for each staining) (k)-indicated histological changes in liver, and corresponding hepatic hydroxyproline & collagen contents in HKO (Trim26) HFHC, HKO (Cebpd) HFHC, DHKO (Trim26-Cebpd) HFHC and Flox HFHC group. Data are expressed as mean ± SEM. The relevant experiments presented in this part were performed independently at least three times. P < 0.05 indicates statistical significance.

