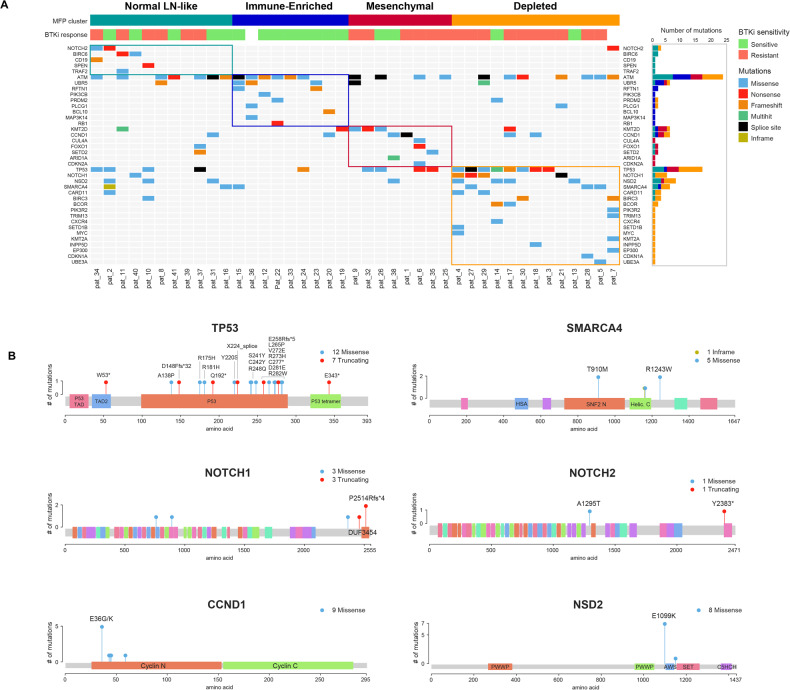
Fig. 2. Somatic mutation profile by whole exome sequencing (WES) and bulk RNA sequencing and association with tumor microenvironment (TME) clusters in mantle cell lymphoma tissue biopsies.
A Oncoplot showing distribution of somatic mutations with bar plots on the right side showing distribution of highly mutated genes in MCL according to the four TME clusters (shown on top of the oncoplot). Immune depleted (orange), mesenchymal (red), immune enriched (blue) and normal lymph node like TME cluster (green). TP53, NOTCH1, NSD2, SMARCA4 mutations previously reported with clinical BTKi resistance in MCL were predominantly observed in immune-depleted TME cluster. B Somatic mutations in highly mutated genes in MCL. Protein domain structure of the 6 highly mutated genes with somatic mutations aligned, with positions and frequencies of the specific mutations is shown. Different colors as shown in the legend indicated the functional domains and mutation types in each gene—TP53, NOTCH1, NSD2, SMARCA4, NOTCH2, and CCND1 genes.

