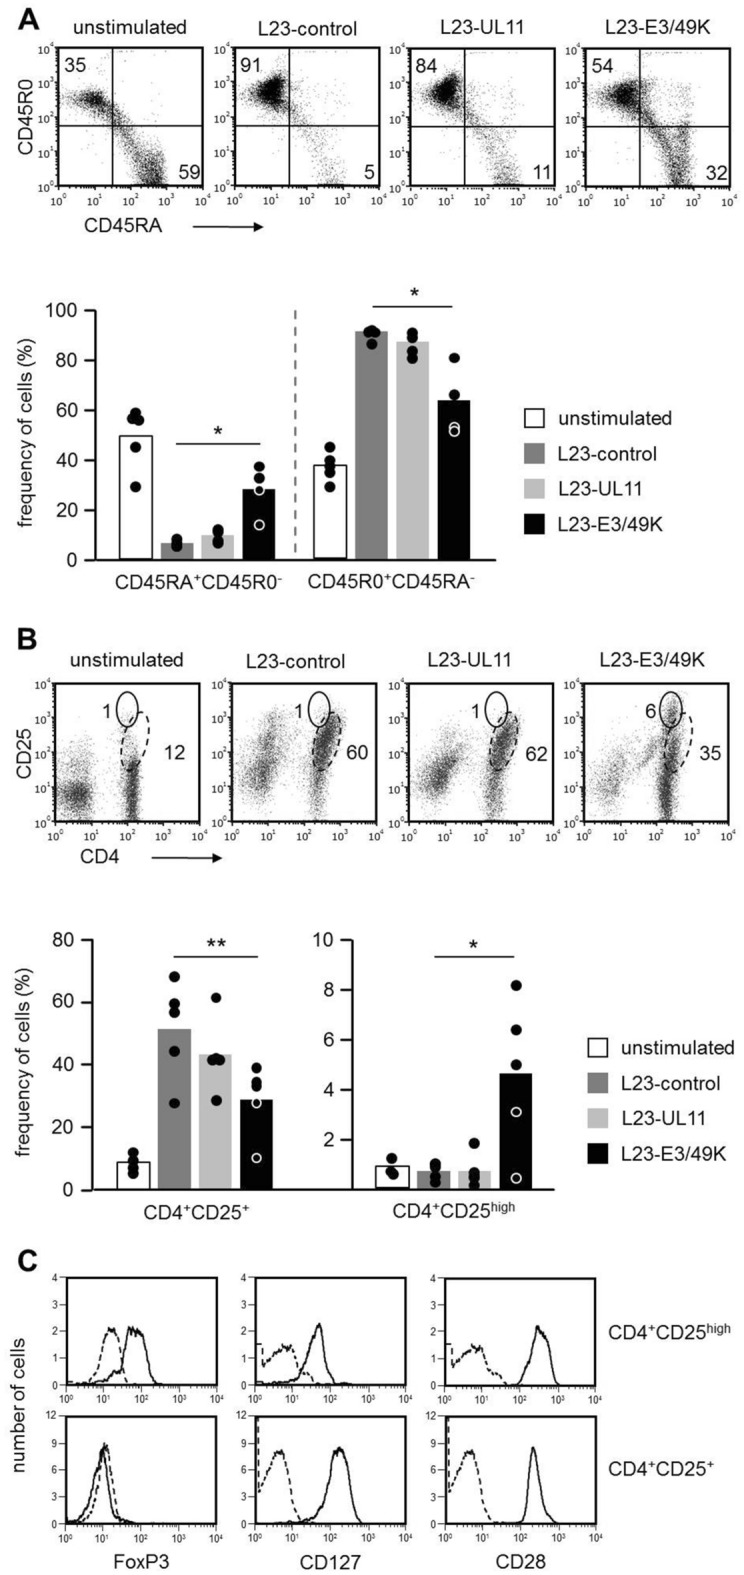
Figure 5.

Phenotypic characterization of human PBMC after chronic stimulation with L23 cells. Human PBMC were analyzed by flow cytometry on day 0 (unstimulated) and on day 28 after repetitive re-stimulation (every week plus fresh medium) using irradiated L23-control, L23-UL11, and L23-E3/49K as stimulator cells. (A) Activation induced alterations of CD45RA and CD45R0 isoforms. The cells were stained by CD45RA in combination with CD45R0 mAb. Forward-/side-scatter gating was performed to exclude porcine L23 cells from the analysis. Data presented as dot plots of CD45RA/CD45R0 co-expression were obtained in a representative experiment. The numbers represent the percentage of CD45RA+CD45R0- (lower right quadrant) and CD45R0+CD45RA- (upper left quadrant) cells. The bar graph summarizes percentages from 5 independent experiments. Statistical significance was determined by ANOVA. (B) Activation induced upregulation of CD25. The cells were stained by CD4 in combination with CD25 mAb. Forward-/side-scatter gating was performed to exclude porcine L23 cells from the analysis. The dot plots show CD4/CD25 co-expression patterns obtained in a representative experiment. CD4+ T cells expressing intermediate levels of CD25 are indicated by dashed ellipses, CD4+CD25high cells by solid ellipses. The numbers represent the percentage of cells in the ellipses. The bar graph summarizes percentages from 5 independent experiments. Statistical significance was determined by ANOVA. (C) Characterization of CD4+CD25high cells. Chronically L23-E3/49K-stimulated cells were stained by CD4 and CD25 in combination with either FoxP3, CD127 or CD28 mAbs. Dashed lines represent isotype controls (FoxP3) or secondary antibodies alone. The histograms were obtained in a single experiment and were confirmed in a second experiment using cells from another blood donor.
