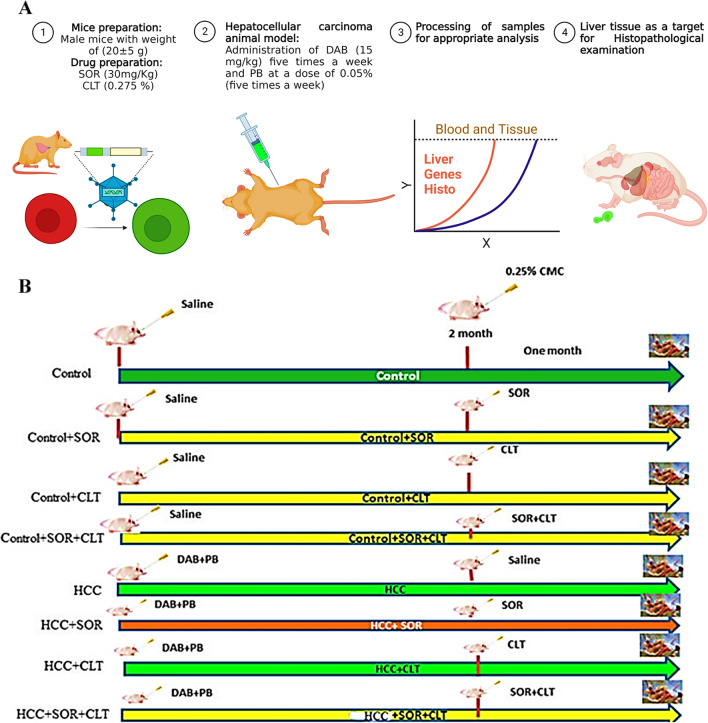
Fig. 1.
A Flowchart outlines all the steps taken to complete the process, as well as the inputs and outputs of each step. It provides a visual representation of the steps taken and is useful for tracking progress and ensuring that all steps are completed correctly. B Animal grouping design: each group contained 15 mice; Group I (negative control group); Group II (control + SOR); Group III (control + CLT); Group IV (control + SOR + CLT); Group V (HCC group); Group VI (HCC + SOR); Group VII (HCC + CLT); Group VIII (HCC + SOR + CLT). Abbreviation: CMC: carboxymethylcellulose; SOR: sorafenib; CLT: dicinnamoyl-L- tartaric acid; HCC: hepatocellular carcinoma

