Fig. 1.
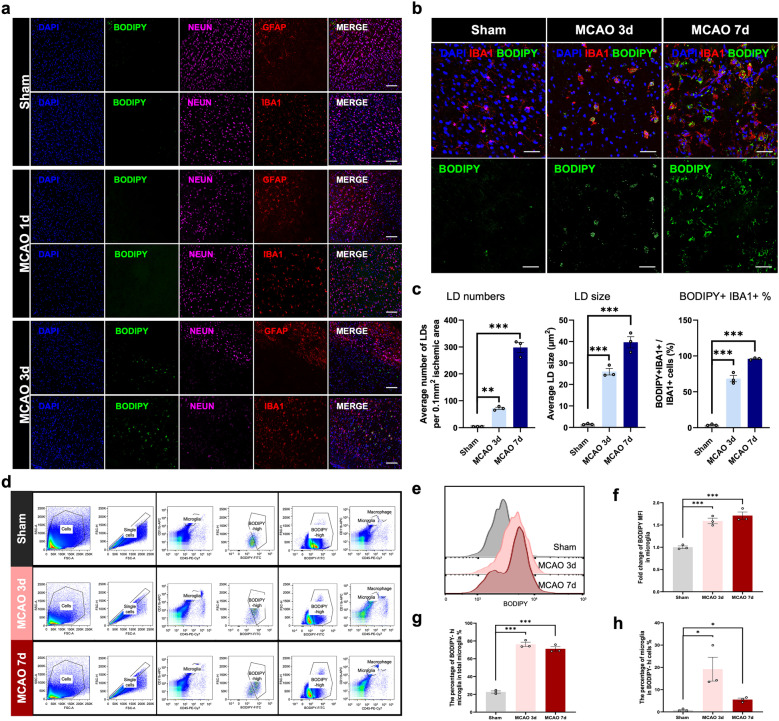
LDs accumulated in microglia after ischemic stroke a Representative immunofluorescence images co-staining neuronal-marker (NEUN), astrocyte-marker (GFAP), microglia/macrophage-marker (IBA1) and lipid droplet dye (BODIPY) within the infarct in the sham or MCAO mouse brain sections under confocal observation (scale bar. 100 µm). b Representative immunofluorescence images stained for microglia/macrophage-marker (IBA1) and lipid droplet dye (BODIPY) in the infarct regions within brain sections of sham and MCAO (3d and 7d post stroke) mice (scale bar. 50 µm). c Quantification of average LD number, LD size and the percentage of BODIPY+IBA1+ cells in all the IBA1+ cells. Data are presented as the mean ± SEM. **P < 0.01, ***P < 0.001, by one-way ANOVA. n = 3/group. d Flow cytometry scheme sorting CD11b+CD45low microglia from the right hemispheres of sham or MCAO (3d and 7d post stroke) mice. BODIPYhigh microglia were further sorted from microglia. CD11b+CD45low microglia were sorted from BODIPYhigh cells at the same time. e Representative flow cytometry histogram showing the mean fluorescence intensity (MFI) of BODIPY in microglia isolated from sham or MCAO mice. f-h Quantitation of BODIPY MFI in microglia sorted from right hemispheres in sham or MCAO mice (3d and 7d post the surgery) f. The percentage of BODIPYhigh microglia in total microglia g and the percentage of microglia among BODIPYhigh cells h were quantified respectively. Data are presented as the mean ± SEM. *P < 0.05, ***P < 0.001, by one-way ANOVA. n = 3/group.

