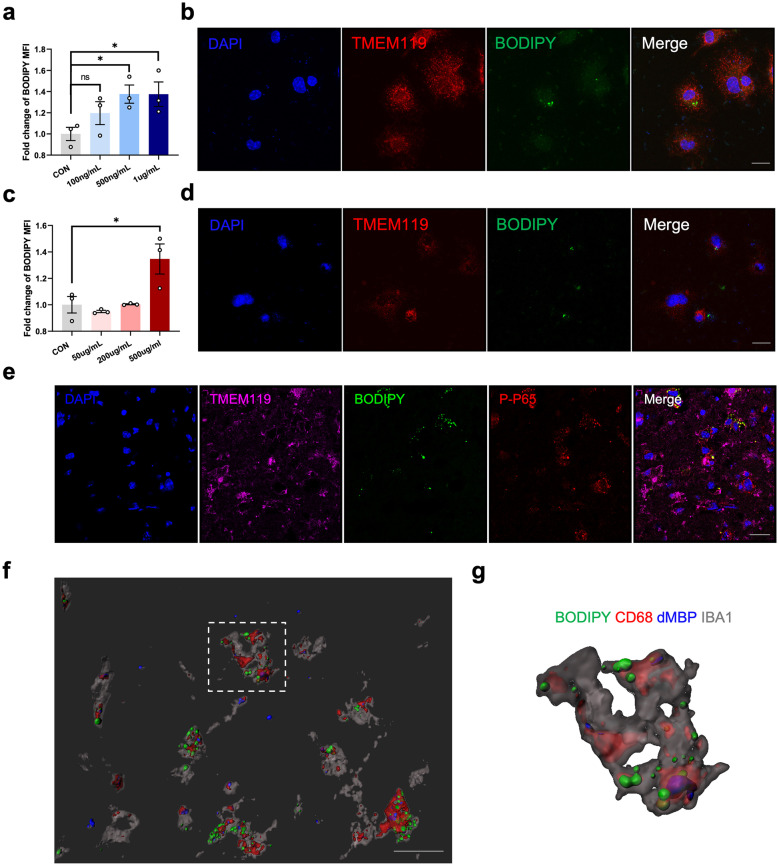
Fig. 3.
Inflammatory microenvironment and debris phagocytosis drove LD formation in microglia. a Quantification of BODIPY MFI, measured by flow cytometry, in primary microglia after LPS treatment at different concentrations (100 ng/mL, 500 ng/mL and 1 μg/mL) for 24 h. Data are presented as the mean ± SEM. *P < 0.05, by one-way ANOVA. n = 3/group. b Representative immunofluorescence images stained for BODIPY (lipid droplet dye) and TMEM119 (microglia marker) in primary microglia after LPS treatment (500 ng/mL, 24 h) (scale bar. 20 µm). c Quantification of BODIPY MFI in primary microglia after cellular debris treatment at different concentrations (50 μg/mL, 200 μg/mL and 500 μg/mL) for 24 h by flow cytometry. Data are presented as the mean ± SEM. *P < 0.05, by one-way ANOVA. n = 3/group. d Representative immunofluorescence images stained for BODIPY (lipid droplet dye) and TMEM119 (microglia marker) in primary microglia after cellular debris treatment (500 μg/mL, 24 h) (scale bar. 20 µm). e Representative immunofluorescence images showing the expression of phospho-NF-κB p65 (p-p65) within BODIPY+TMEM119+ cells in the infarct from MCAO 3d mice brain sections (scale bar. 50 µm). f, g 3D reconstruction of the existence of degraded MBP (dMBP) within CD68+BODIPY+IBA1+ cells f (scale bar. 20 µm). The right panel was the magnification of the selected cells g.

