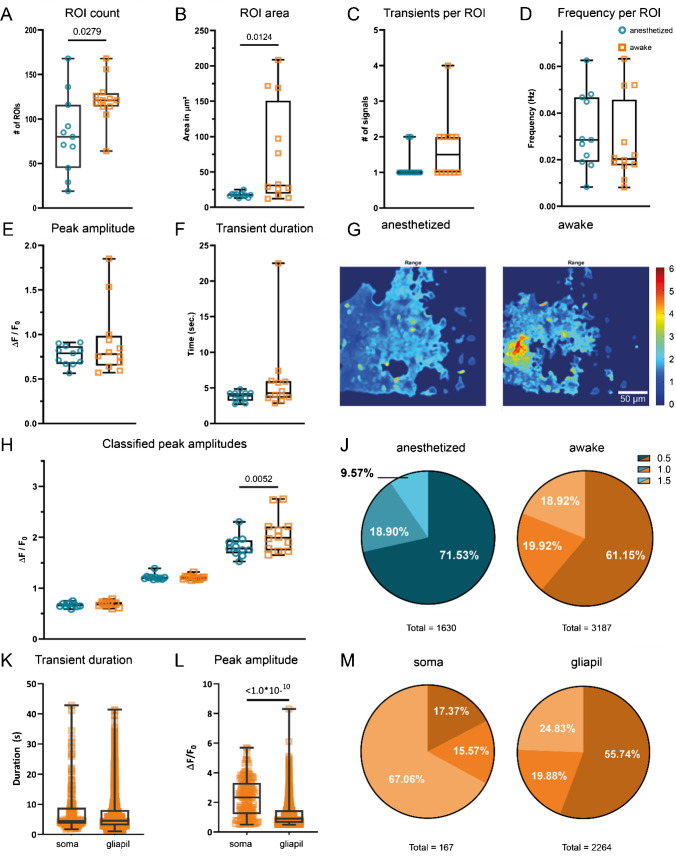
Fig. 3.
Statistical analysis and transient characterization of Ca2+ signals in GCaMP3-expressing mice. The median number of detected ROIs (A), as well as the ROI area (B), increased in awake mice. The median number of transients per ROI also doubled in awake mice expressing GCaMP3 (C). Per-ROI transient frequencies did not change (D). The overall median transient peak in awake mice did not change (E). Overall median transient duration showed no change in awake mice (F). The range projection of ∆F/F0 indicates the amplitude and extent of fluorescence fluctuations (G). Individual classes (H, J) show not only an increase in median amplitude above 1.5 ∆F/F0 (H) but also a relative increase (signal composition) in strong transients during wakefulness (J). Differential analysis of somatic transients and transients occurring in the gliapil (K, L, M) shows similar median durations (K). Somatic transients exhibit not only a higher median peak amplitude (L), but also occur mostly as high amplitude transients (M), compared to transients in the gliapil

