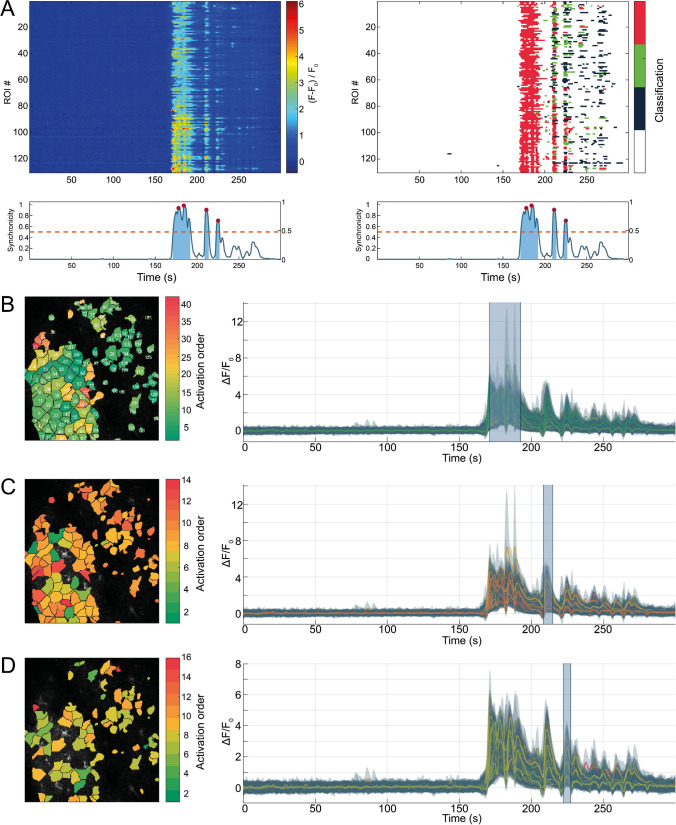
Fig. 4.
Synchronous events are diverse. Three separate but consecutive synchronous events in the same recording. Synchronous events are qualitatively assessable via kymographs, showing unclassified fluorescence profiles (A, left) as well as classified transients (A, right). In addition, synchronicity plots (A, beneath kymographs) allow to quantify the relative frequency of synchronous activity, with respect to the number of detected ROIs. Synchronous periods above threshold (red, dashed line) are highlighted (blue areas), and peaks in synchronicity are marked (red circles). Analyzing individual synchronous events can reveal activation patterns. Here, color indicates first activation of ROIs, from beginning (green) to end (red) of synchronous event. (B) The first synchronous event spread through all of the detected ROIs. (C) The second and third (D) synchronous event occured in successively smaller subsets of the detected ROIs. All three events exhibited different activation sequences, and ROIs had substantially different activation time points despite being spatially close to one another. Highlighted time-spans in the attached fluorescence profiles (B, C, D, right) indicate affected period of synchronicity

