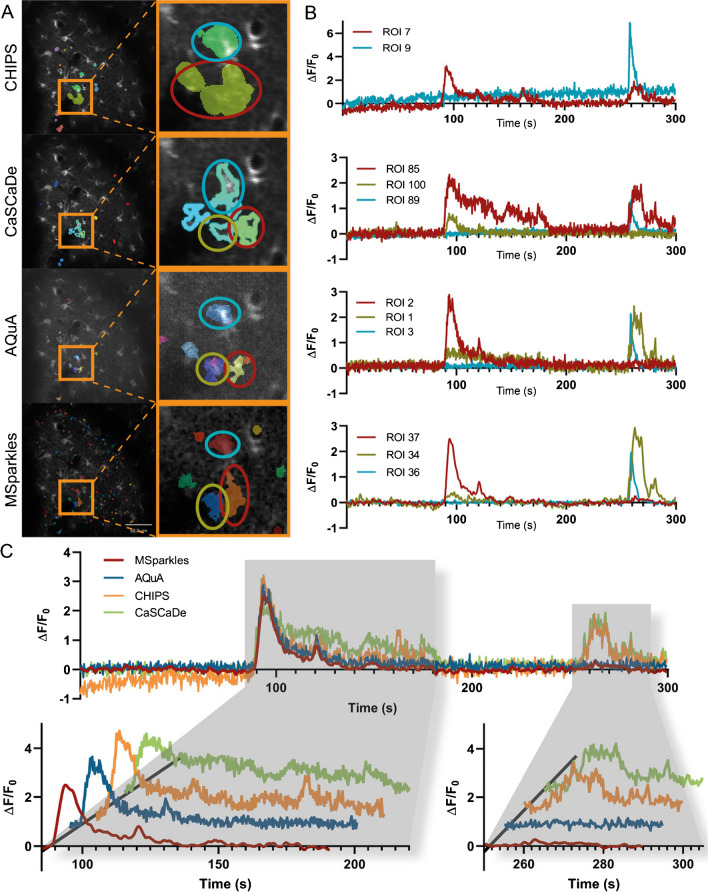
Fig. 6.
Comparison of ROI detectors. (A) ROIs detected by individual Ca2+ analysis tools. Highlighted areas contain fluorescence activity, similarly detected by all tested applications. Comparing ROIs of the magnified areas reveals segmentation differences, as well as differences in size among Ca2+ analysis tools. (B) Fluorescence profiles of magnified ROIs marked with red, yellow, and blue ellipses. Profiles obtained using CHIPS show an increase in background fluorescence over time. Especially the profiles obtained with CHIPS and CaSCaDe differ to those obtained with AQUA and MSparkles. AQuA and MSparkles performed a more accurate segmentation between the ROIs marked with red and yellow ellipses, which is reflected by the corresponding fluorescence profiles. (C) Direct comparison of fluorescence profiles marked by the red ellipse. Profiles are similar around the first event occurring between 90s and 180s. Profiles by CHIPS and CaSCaDe show a third peak and prolonged event, respectively. CHIPS and CaSCaDe show a second fluorescence event at around 270s. AQuA and MSparkles detected this as a separate event, located at the ROI highlighted in yellow

