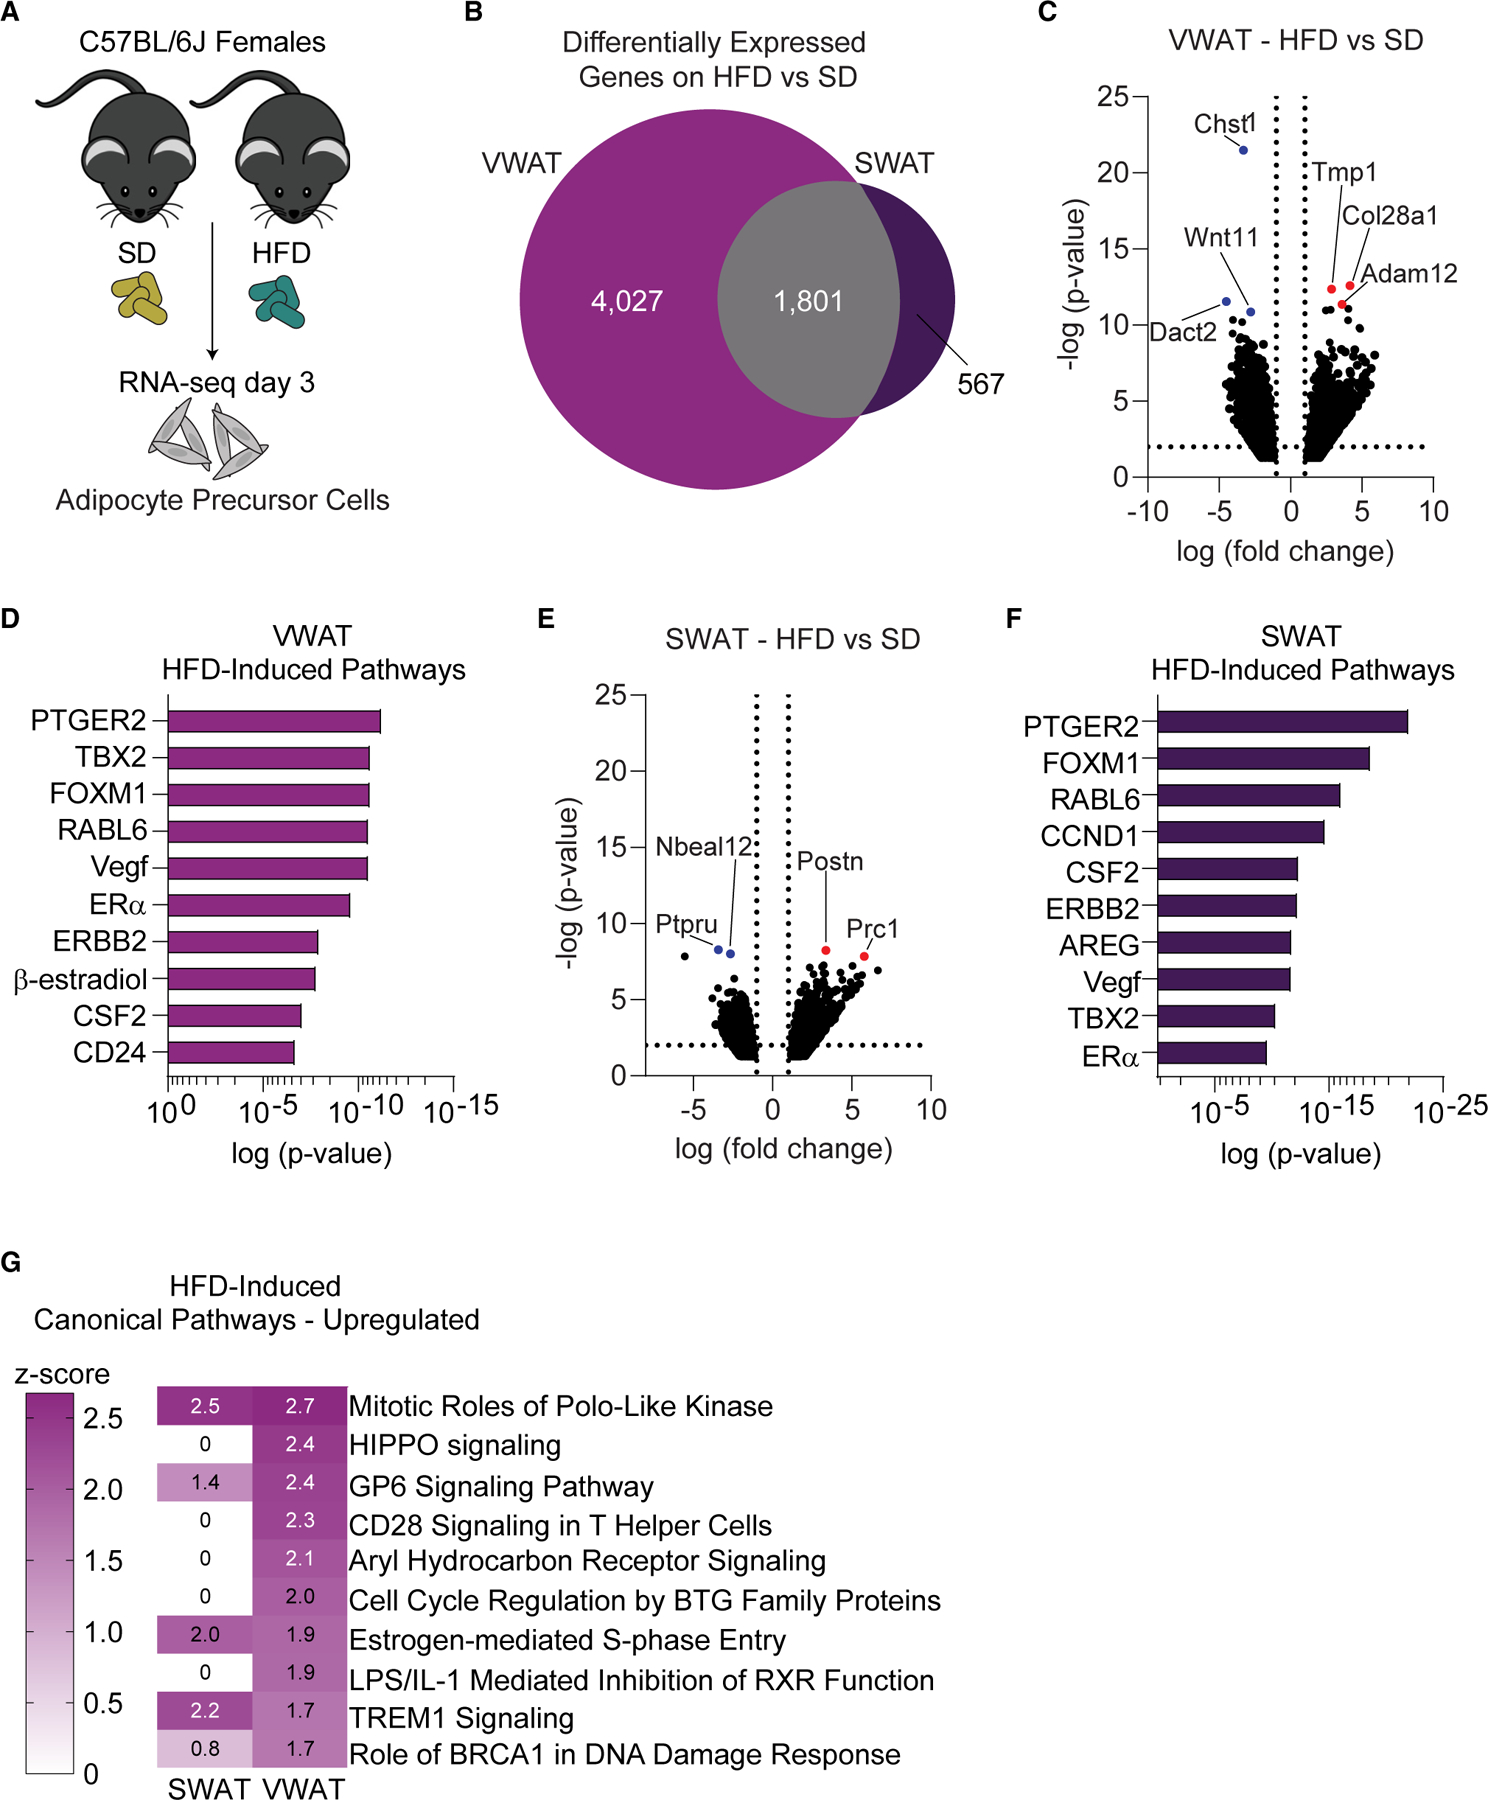
Figure 1. Estrogen pathways are upregulated in female APCs at the onset of HFD.

(A) Schematic representation of RNA sequencing experiment in female mice.
(B) Venn diagram of HFD-induced DEGs in female VWAT and SWAT.
(C) Volcano plot of HFD-induced DEGs in female VWAT. Top 3 genes with lowest p values are colored in red (upregulated) or blue (downregulated).
(D) Top positive upstream regulators on an HFD in VWAT as predicted by Ingenuity Pathway Analysis. Gene predictions are in uppercase.
(E) Volcano plot of HFD-induced DEGs in female SWAT. Top 2 genes with lowest p values are colored in red (upregulated) or blue (downregulated).
(F) Top positive upstream regulators on an HFD in SWAT as predicted by Ingenuity Pathway Analysis. Gene predictions are in uppercase.
(G) Top canonical pathways with a positive Z score induced by HFD as predicted by IPA.
n = 5 samples per group, 3 mice pooled for each sample. VWAT, perigonadal fat; SWAT, inguinal subcutaneous fat; SD, standard diet; HFD, high-fat diet; DEGs, differentially expressed genes.
See also Figure S1.
