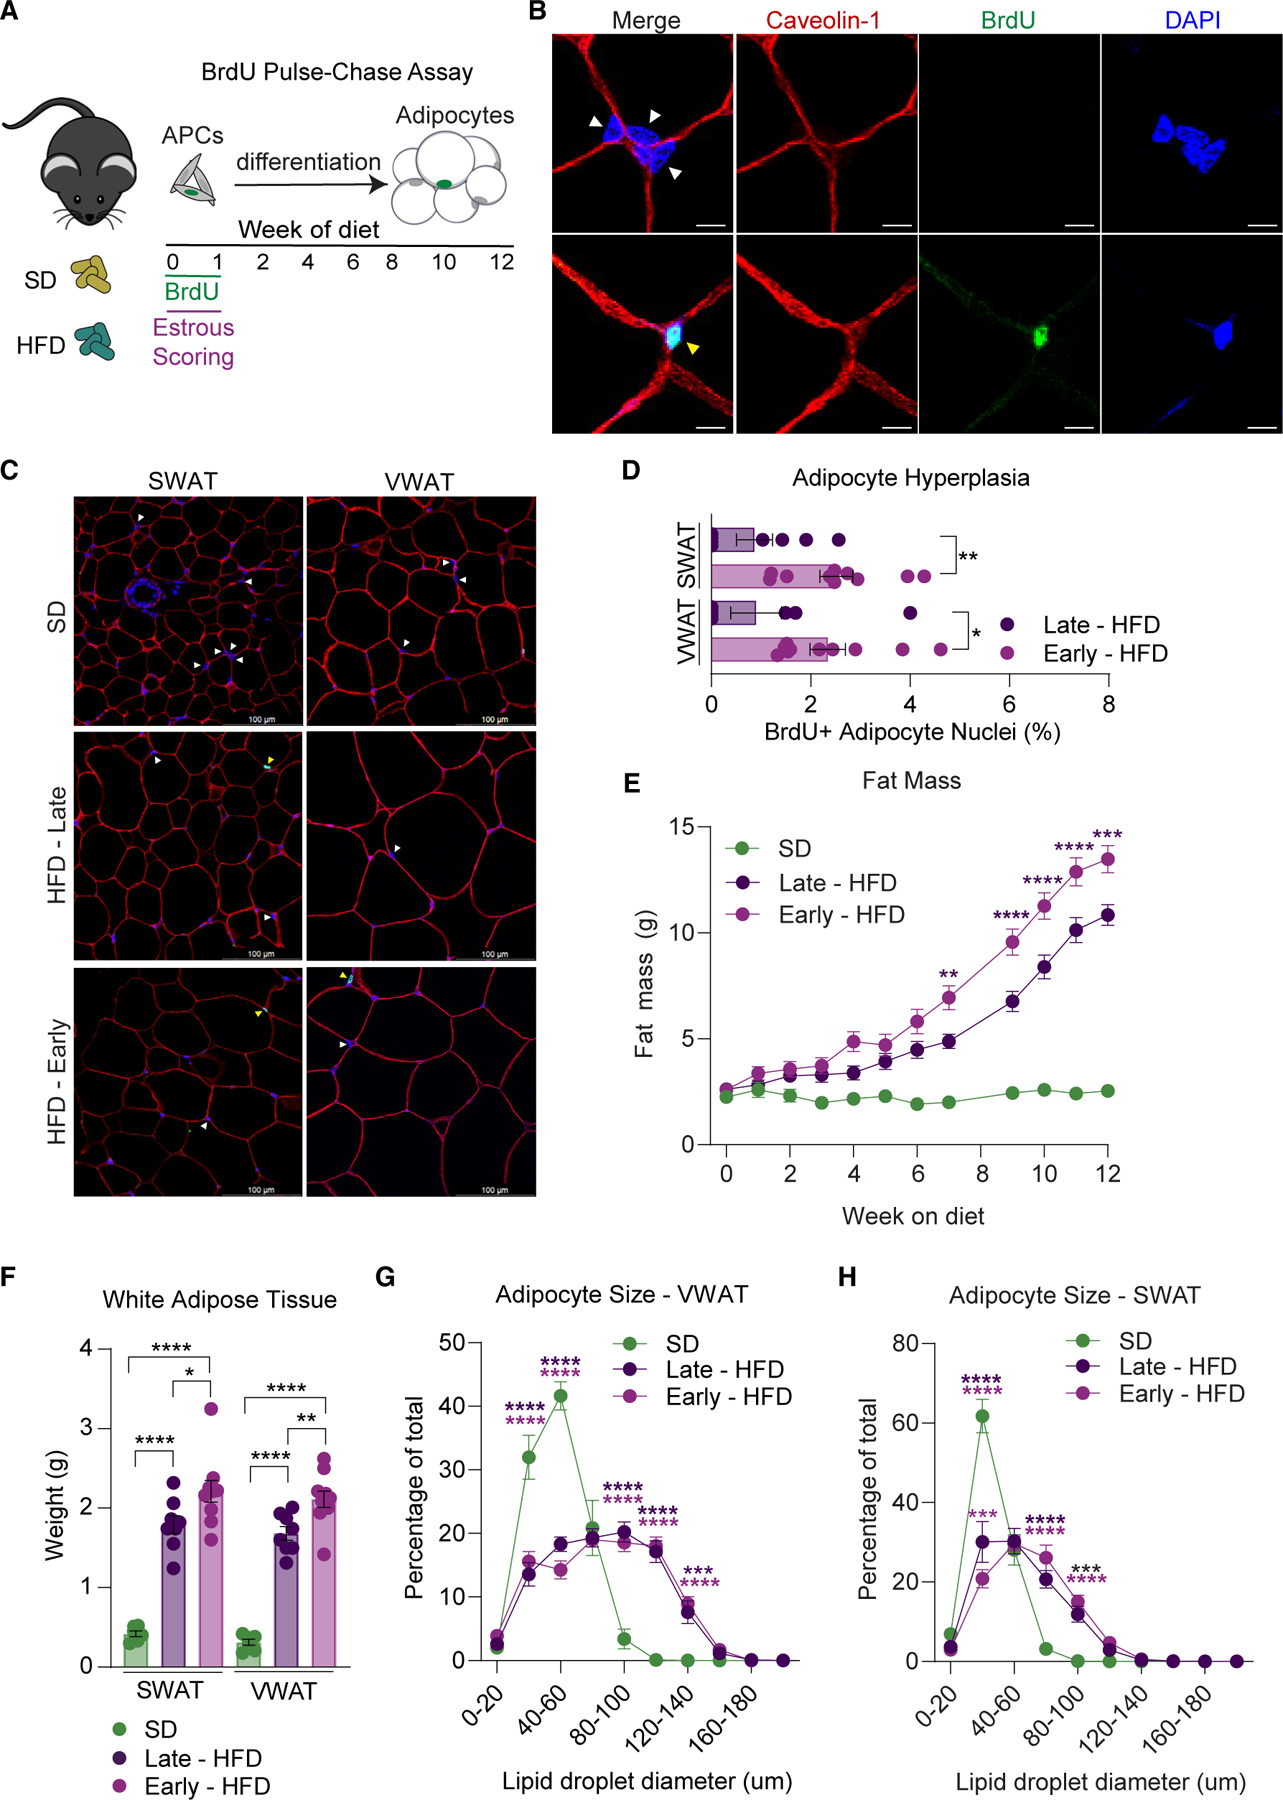
Figure 4. Timing of HFD determines hyperplasia in female mice.

(A) Schematic of BrdU pulse-chase assay in combination with estrous scoring. Briefly, BrdU was given during the first week of diet along with estrous scoring and then chased for 12 weeks to allow APCs to differentiate into adipocytes.
(B) Representative images of immunofluorescence staining in SWAT to quantify BrdU incorporation in adipocyte nuclei. Tissue is stained for caveolin-1 to visualize adipocyte plasma membranes, DAPI to visualize nuclei, and BrdU. Adipocyte nuclei are indicated with arrowheads (yellow indicates BrdU+ and white indicates BrdU−) and are identified by their location inside the adipocyte plasma membrane. Scale bar is 25 μm.
(C) Representative images of WAT from females fed an SD or HFD for 12 weeks stained with caveolin-1, DAPI, and BrdU. Examples of adipocyte nuclei (white arrows) and BrdU+ adipocyte nuclei (yellow arrows) are shown. 30–35 images were taken per tissue to ensure at least 200 adipocyte nuclei were counted. Scale bar is 100 μm, images taken at 40×.
(D) Adipocyte hyperplasia analysis from female SWAT and VWAT after 12 weeks of HFD feeding.
(E) Total fat mass during 12 weeks of SD or HFD feeding in female mice.
(F) SWAT and VWAT weight after 12 weeks of SD or HFD feeding.
(G and H) Histogram of VWAT (G) and SWAT (H) adipocyte size from females after 12 weeks of feeding.
n = 6–10 mice per group. Statistical significance was determined by unpaired t test for (D), ordinary one-way ANOVA with Tukey’s test for (F), and ordinary two-way ANOVA with Tukey’s test for (E), (G), and (H). Error bars represent mean ± SEM. ns, not significant, *p < 0.05, **p < 0.01, ***p < 0.001, ****p < 0.0001. APCs, adipocyte precursor cells; VWAT, perigonadal fat; SWAT, inguinal subcutaneous fat; SD, standard diet; HFD, high-fat diet; BrdU, bromodeoxyuridine.
See also Figures S3 and S4 and Table S1.
