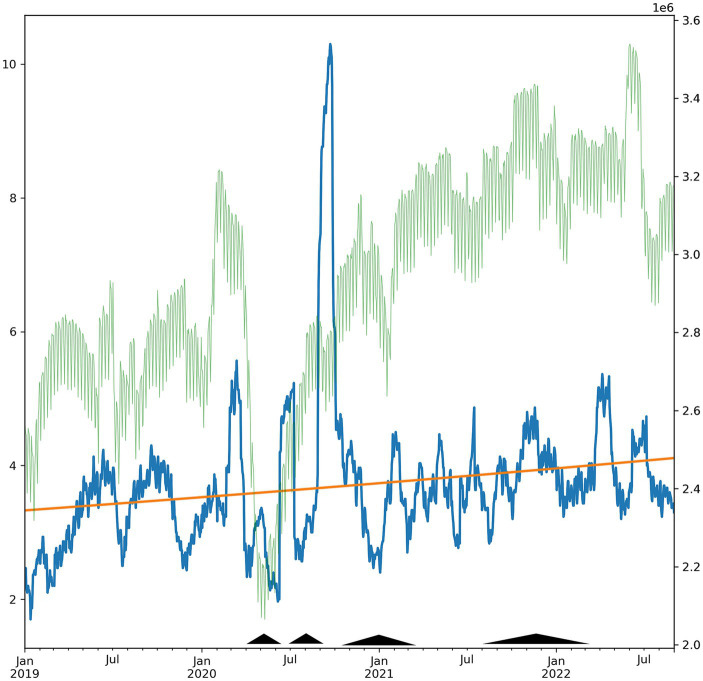
Figure 1.
Daily count of exploitation-related ICD-10 codes from 2018-09-01 through 2022-09-01 (blue, left axis, 30-day moving average). Use of the codes increased 5.8%, representing a decrease of −0.9% per year relative to the growth of the data (6.7% per year). Superimposed trendline (orange) and overall new claims in the database (faint green, 30-day moving average). Pyramids indicate elevated in COVID-19 mortality in the US (periods with >5,000 weekly cases), as reported by the CDC COVID Tracker (covid.cdc.gov).

