
Figure 2. Overview of MERCI and application to the ground-truth data.
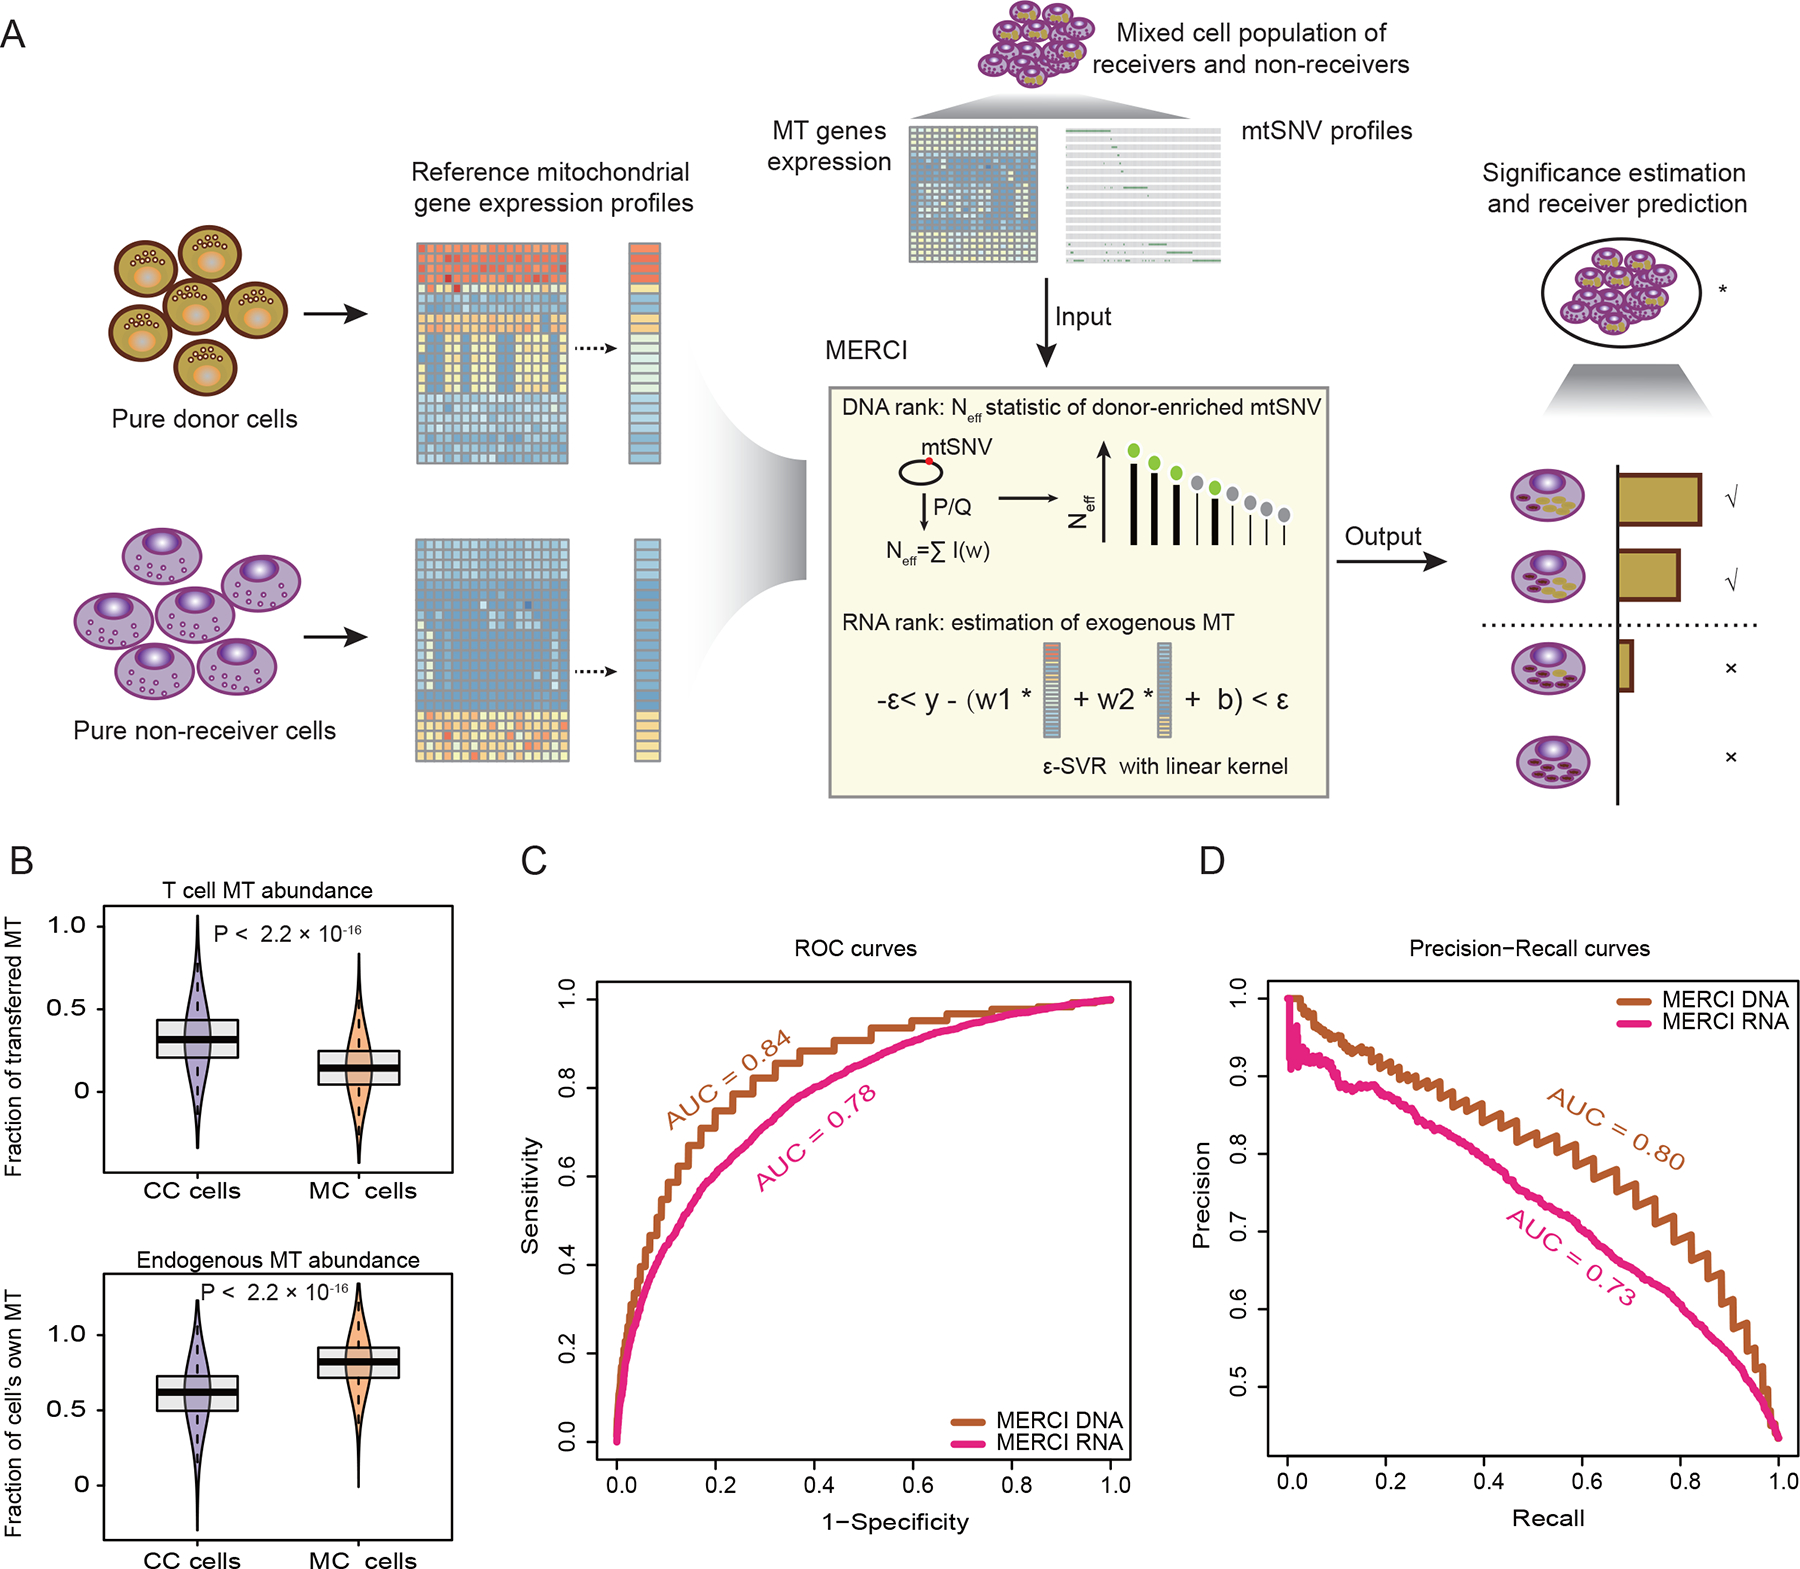
(A) Schematic illustration of MERCI. Single cell RNA-seq data from reference donor and non-receiver cells were used to deconvolute MT fractions in the cancer cell population. By combining ranks from DNA and RNA information, MERCI estimates the statistical significance of the existence of true MT receivers, and evaluates each candidate cancer cell as a receiver or not. (B) Boxplots showing the estimated abundance (SVR coefficients) of T cell transferred (upper) and endogenous mitochondria (lower) in CC and MC cancer cells. Lower and upper box limits represent 25th to 75th percentiles, central line the median and the whiskers extend to highest and lowest values no greater than 1.5× interquartile range; the violin component refers to the kernel probability density and encompasses all cells. Statistical significance was evaluated using two-sided Wilcoxon rank sum test. (C-D) Receiver operating characteristic (ROC) (C) and precision-recall (PR) (D) curves using MERCI-derived rank scores as predictors of mitochondrial receivers, i.e. CC cells. Area under the ROC and PR curves (AUC) were labeled. See also Figure S3.