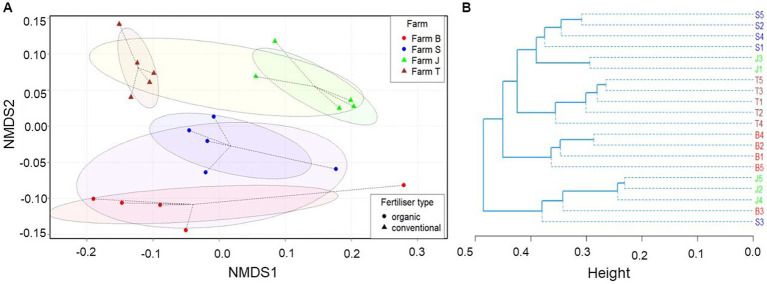
Figure 2.
Bray-Curtis dissimilarity between bacterial communities. (A) Comparison of observed ASVs between organic and conventional fertilization and across farms based on non-metric multidimensional scaling (NMDS). (B) Unweighted paired group mean arithmetic (UPGMA) hierarchical cluster dendrogram. The eclipses in the NMDS plot show 95% confidence intervals (standard error) in multivariate space within the group centroids, while the dotted lines indicate the distance of each sample to its group centroid in multivariate space. The stress plot (Supplementary Figure S5B) for the NMDS showed that the original dissimilarities are well preserved (stress = 0.165047) in the reduced number of dimensions.

