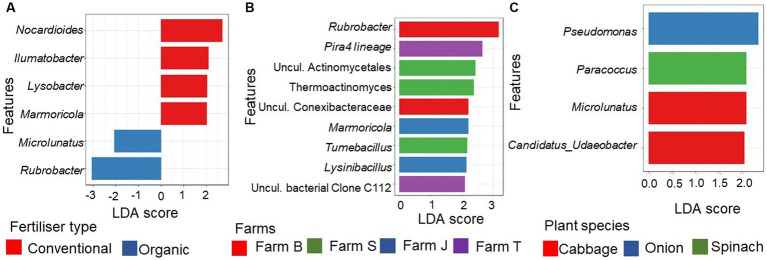
Figure 4.
Differentially abundant genera of the rhizosphere bacterial communities. (A) Top 6 statistically significant discriminant (FDR-adjusted p-value < 0.1, LDA score > 2.4) genera between organic and conventional farms (B) Top 9 discriminant (FDR-adjusted p-value < 0.05, LDA score > 2.0) between the farms. (C) Differentially abundant genera (FDR-adjusted p-value < 0.1, LDA score > 2.0) between the plant species. The bar plot was generated using the Linear Discriminant Analysis (LDA) Effect size (LefSe) in the R using the microeco package. Uncul., uncultured.

