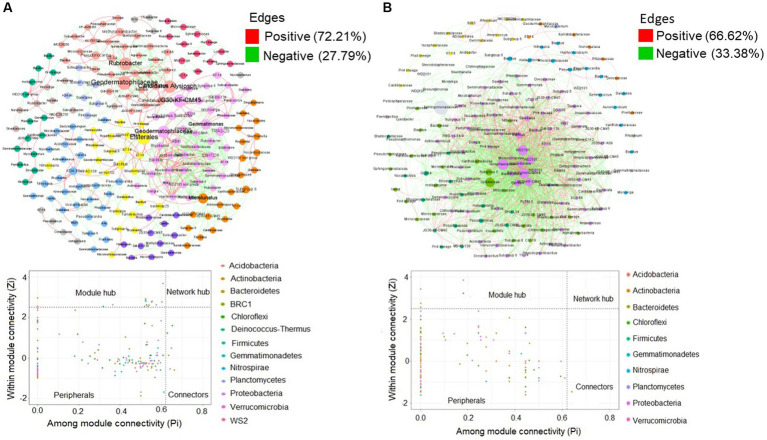
Figure 7.
Co-occurrence networks of bacterial communities and classification of nodes for detection of keystone taxa within ecological networks in (A) organic and (B) conventional farm rhizosphere soil. The nodes represent bacterial species (round shape), colored according to the community modularity class. Node sizes are proportional to their degree of distribution, and nodes having less than two connections have been removed. Edges are network connections signifying significant (FDR-adjusted p < 0.01) associations between nodes. Positive associations are colored red, while negative associations are colored blue. Detected module hubs in the two farm networks are linked with Acidobacteria, Actinobacteria, Proteobacteria and Chloroflexi, while the connectors are affiliated with Actinobacteria for both organic and conventional farms. The co-occurrence network statistics are presented in Table 3.

