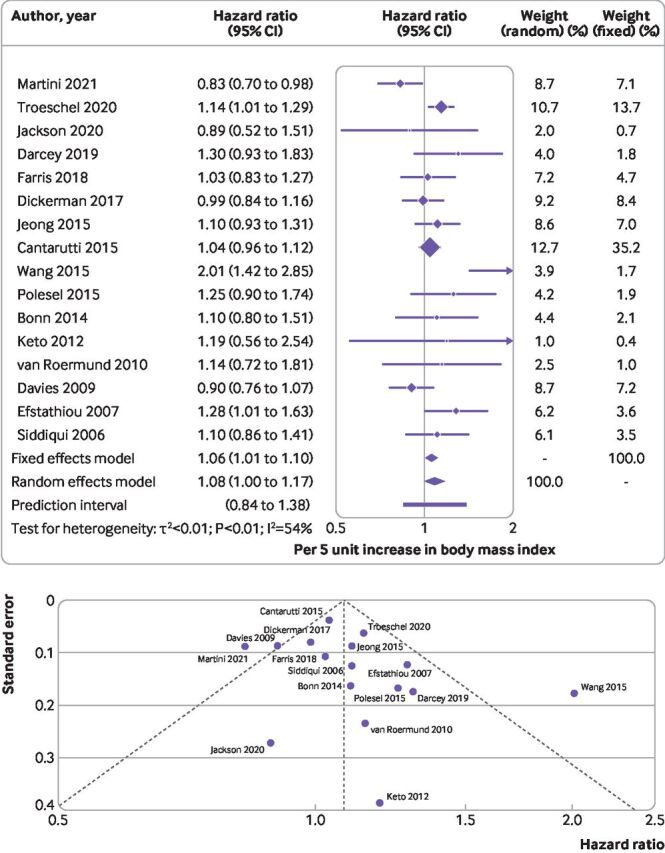
Figure 4.

(Top) Summary hazard ratio (95% confidence interval) of mortality specific to prostate cancer for every 5 unit increase in body mass index after diagnosis of prostate cancer. Forest plot shows results from the random and fixed effects models. Diamond symbol represents the summary hazard ratio. Each symbol represents the hazard ratio estimate of each study and the horizontal line across each square represents the 95% confidence interval of the hazard ratio estimate. Horizontal line across the hazard ratio axis represents the 95% prediction interval. (Bottom) Funnel plot shows logit transformed hazard ratios plotted on the horizontal axis against the standard error of the logit transformed hazard ratios plotted on the vertical axis. Each symbol represents an individual study, and the vertical line represents the summary hazard ratio from a random effects meta-analysis. The diagonal lines represent pseudo 95% confidence limits (Egger’s P=0.23)
