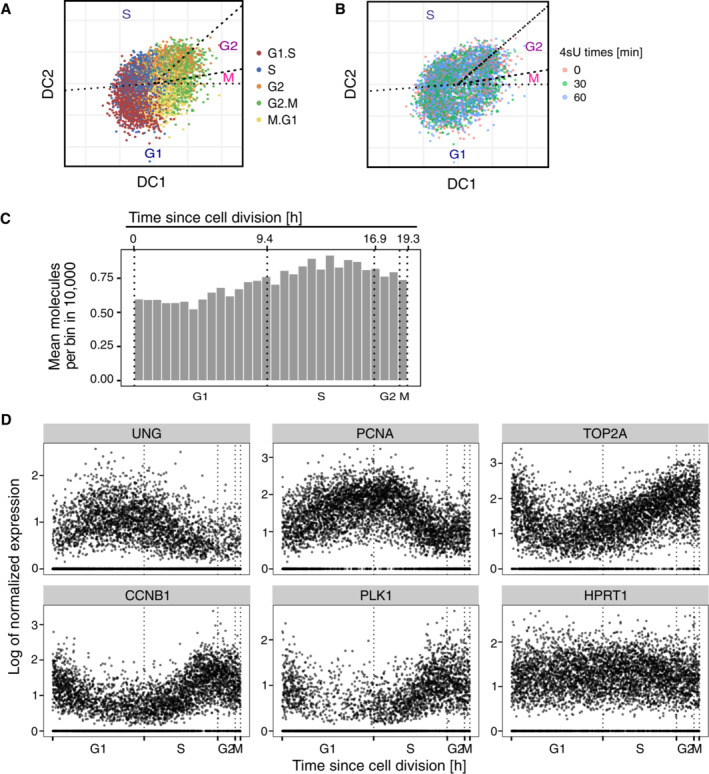
Figure EV1. Asynchronous cells are sorted to a continuous cell cycle time using gene expression of single cells.

- The two‐dimensional representation of the cells after dimensional reduction using Revelio (also see Fig 2A). Cells are pooled from batch 1 (i.e., 0, 30 and 60 min 4sU samples). Colors correspond to the cell cycle phase identities assigned using known cell cycle marker genes.
- Cells from different 4sU labeling times are randomly distributed within the cell clouds on the DC plot.
- The number of mean molecules per bin gradually increases along the cell cycle progression. Neighboring cells were grouped into 30 bins and the mean number of UMIs was used for the bar plots. The cells are the same ones as shown in (A) and (B).
- Representative gene expression profiles along the cell cycle (G1/S markers: UNG, PCNA; G2/M markers: CDK1, TOP2A, PKL1; House‐keeping gene: HPRT1). The cells are the same ones as shown in (D). Gene expression levels were normalized by dividing the raw counts by the total RNA contents per cell and then scaled with 2 × 10⁴.
