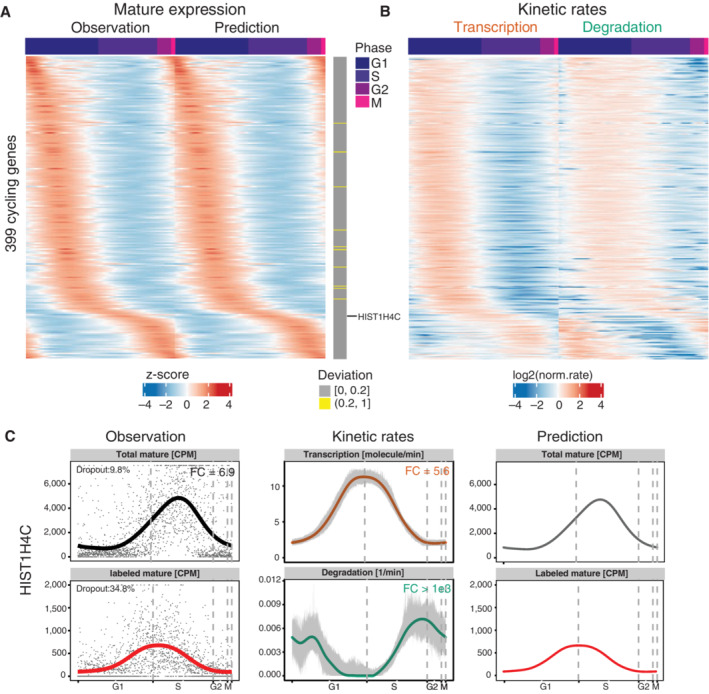
Figure 3. Gene expression and kinetic rates for cycling genes are highly dynamic along the cell cycle.

- Gene expression of mature mRNAs for 399 cycling genes as quantified from sequencing data (i.e., observation) and as predicted (i.e., prediction) from calculated transcription and degradation rates along the cell cycle. The gray vertical bars on the right show the mean relative deviations between observation and prediction (see Materials and Methods). 389 out of those genes were identified as well‐predicted (deviation ≤ 0.2). Genes on rows were ordered by the peak time of the observation. Expression values were centered and scaled across cells for each gene.
- The calculated transcription and degradation rates for the genes shown in (A) along the cell cycle. The rates were normalized to their mean per gene and log2 transformed (transcription rates [molecules/min], degradation rates [1/min]).
- Profiles of the observed gene expression, the calculated kinetic rates and the corresponding predicted expression of HIST1H4C gene. Left panel: Observed gene expression levels (i.e., points) and their smoothed profiles (i.e., lines). CPM, counts per million. Total mature RNA is the sum of labeled and unlabeled mature RNAs. Middle panel: Kinetic rates calculated from the smoothed gene expression profiles are shown by the solid lines. The gray bands show the 90% confidence intervals (i.e., the 5–95% quantiles) of the rates calculated from bootstrapping (resampling of cells 100 times with replacement). Right panel: The predicted expression profiles of labeled and total mature RNAs that derived from the calculated rates.
