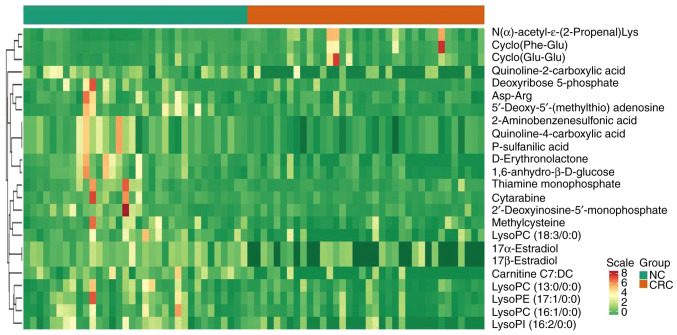
Figure 3.
Heatmap indicating differential metabolites from individual pairwise comparisons between CRC and normal tissues (n=35/group). All represented differential metabolites are statistically significant (variable important in projection ≥1 and absolute Log2 FC ≥1, P<0.05), scale indicates z-score. NC, adjacent normal tissue; CRC, colorectal cancer tissue; lysoPC, lysophosphatidylcholine; lysoPI, lysophosphatidylinositol; lysoPE, lysophosphatidylethanolamine.

