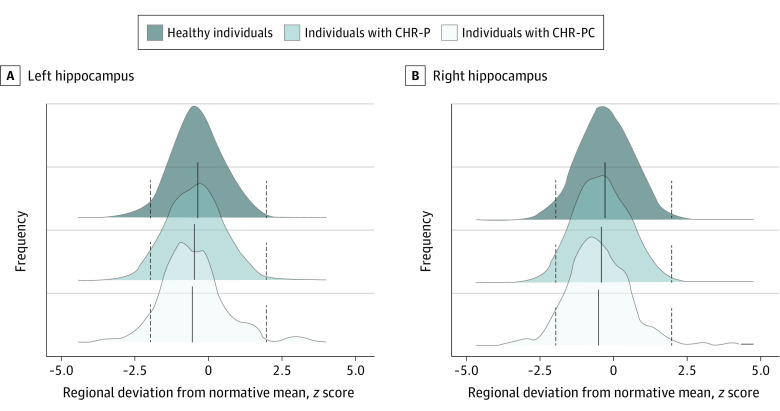
Figure 1. Distribution of Hippocampal Subcortical Volume Normative z Scores in the Study Sample.
The hippocampus is used as an exemplar because the same pattern was observed for all regions (eFigures 4 and 5 in Supplement 1). The dotted vertical lines represent the cutoffs for infranormal (z < −1.96) and supranormal (z > 1.96) values. CHR-P indicates clinical high risk for psychosis; and CHR-PC, clinical high risk for psychosis converted to a psychotic disorder.

