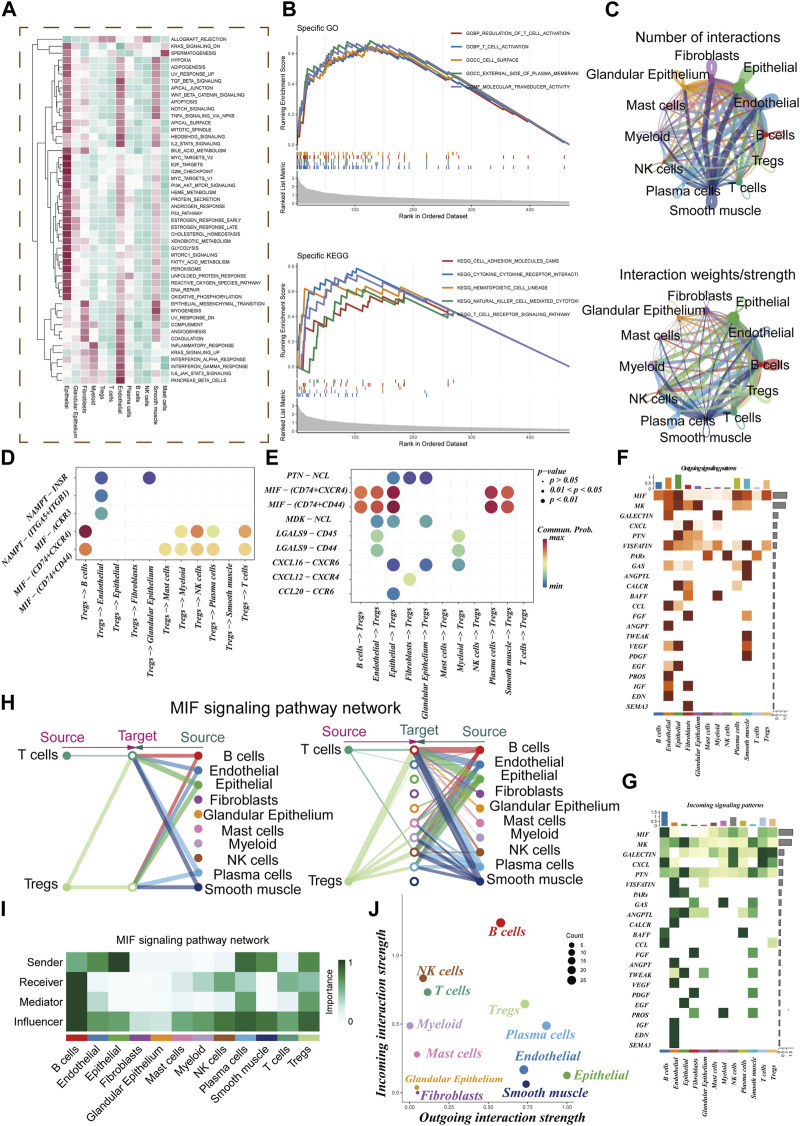
FIGURE 3.
Cell-cell communication. (A) GSVA Enrichment Analysis: This panel depicts the enrichment of different cell subsets in the 50 hallmark gene sets. (B) GO and KEGG Enrichment Analysis: Here, we present the results of enrichment analysis focusing on marker genes in Treg cells. (C) Interaction Intensity: This section displays the number and intensity of interactions between different cell populations within the tumor microenvironment (TME). (D,E) Ligand-Receptor Pairs: These bubble plots highlight potential ligand-receptor pairs between Treg cells and other cell subpopulations in the TME. (F,G) Signaling Pathway Strength: Heatmaps visually represent the strength of outgoing and incoming signaling pathways across various cell subpopulations. (H,I) Role in MIF Signaling Pathway: This section outlines the roles of different cell populations in the MIF signaling pathway network within the TME. (J) Scatter Plot: Lastly, a scatter plot showcases the distribution of different cell populations concerning the intensity of outgoing and incoming signaling interactions.

