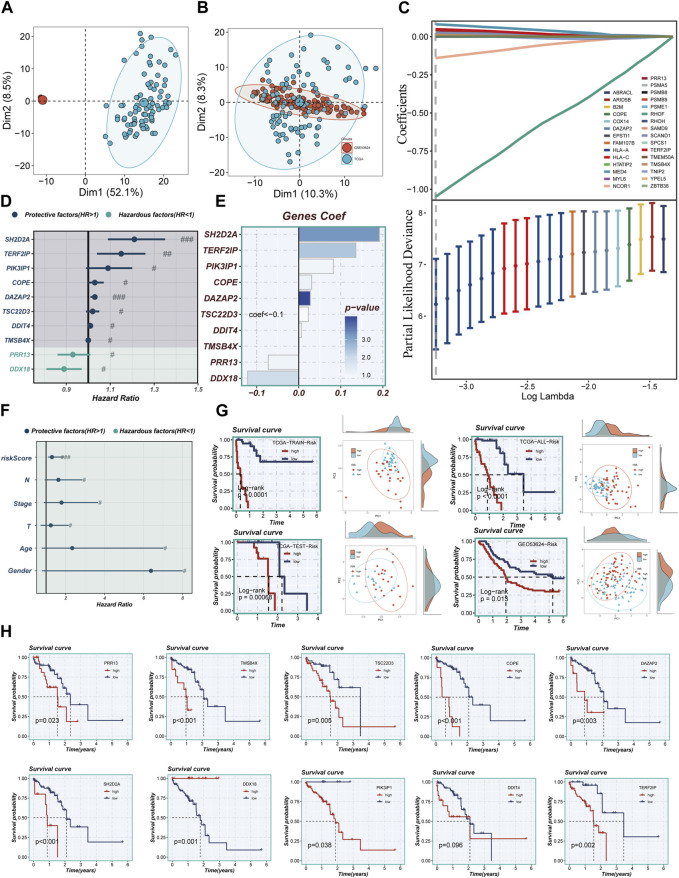
FIGURE 4.
Construction of a stable risk model. (A,B) Sample distribution characteristics of two bulk RNA-seq cohorts before and after removal of batch effects. (C) LASSO regression screening for significant variables affecting prognosis. (D) Forest plot showing the results of multivariate COX analysis. (E) Distribution of coefficient values of model genes. (F) A forest plot was used to validate the constructed riskscore as an independent prognostic model. (G) The survival differences and PCA sample distribution of different risk groups in TCGA-TRAIN, TCGA-TEST, TCGA-ALL, and GEO53624, respectively, were presented. (H) Survival validation of the model genes. Note: # represents p < 0.05; ## represents p < 0.01; ### represents p < 0.001.

