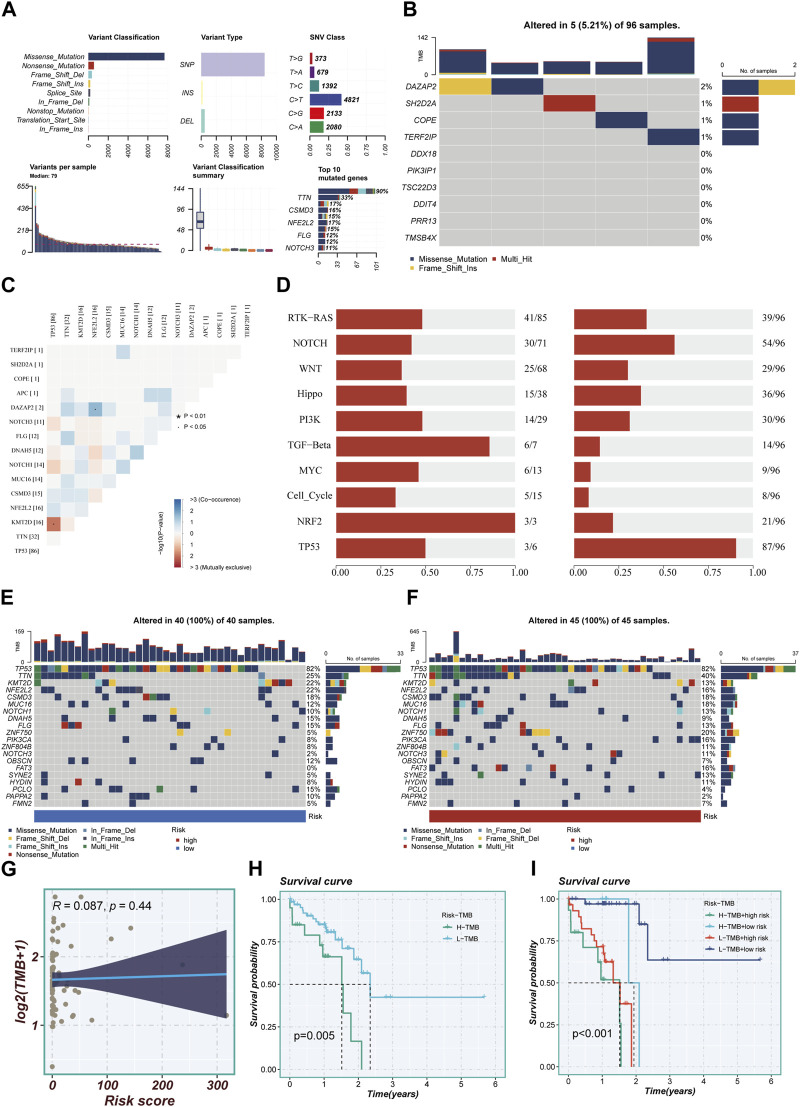
FIGURE 6.
Mutation landscape in high- and low-risk groups. (A) Summary of mutational features in TCGA-ESCC samples. (B) An oncoplot of model genes in the TCGA-ESCC cohort. (C) Co-occurrence and mutual exclusivity relationships among the Top 15 ranked genes with mutations. (D) Enrichment status of 10 tumor-associated pathways. (E,F) mutation landscape of top 20 genes in high-risk and low-risk groups. (G) Scatter plot of correlation between risk scores and TMB. (H) Survival disparities between high and low mutation burden groups. (I) Survival curves showing the difference between survival among four subgroups (high-risk and high-mutation, high-risk and low-mutation, low-risk and high-mutation, low-risk and low-mutation).

