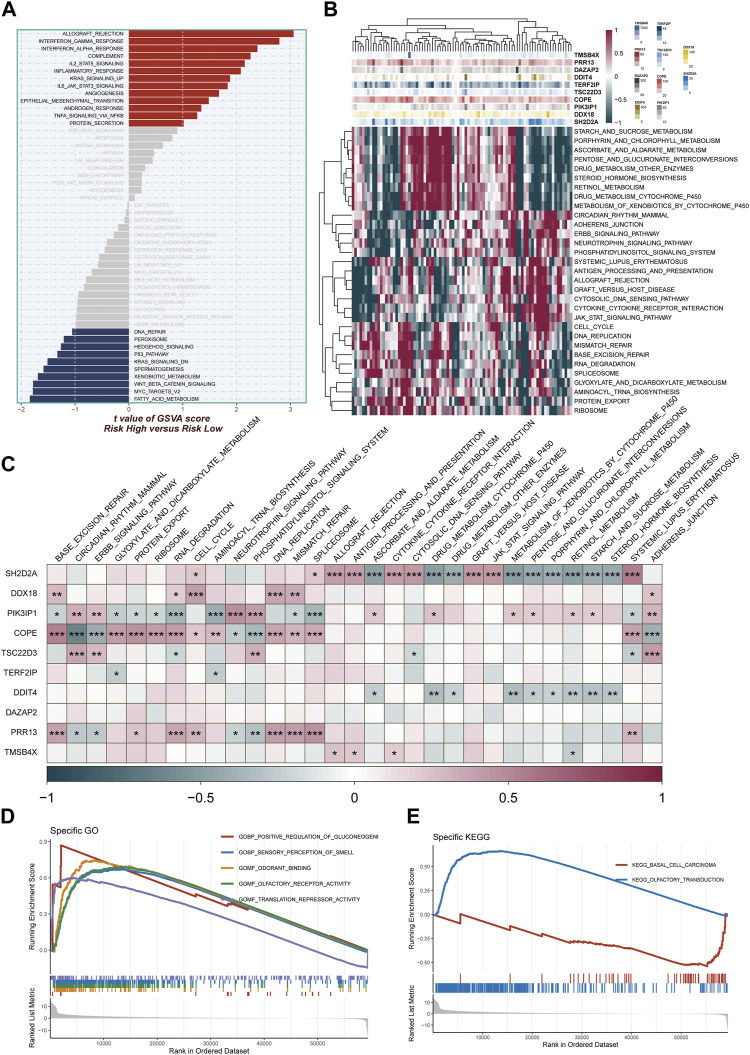
FIGURE 7.
Enrichment pathways between different risk groups. (A) GSVA enrichment analysis demonstrates the enrichment of hallmark gene sets between different risk groups. (B,C) Heatmap and correlation plot depict the association between model genes and KEGG pathways. (D,E) GSEA enrichment analysis demonstrating the enrichment of GO and KEGG pathways between high- and low-risk groups.

