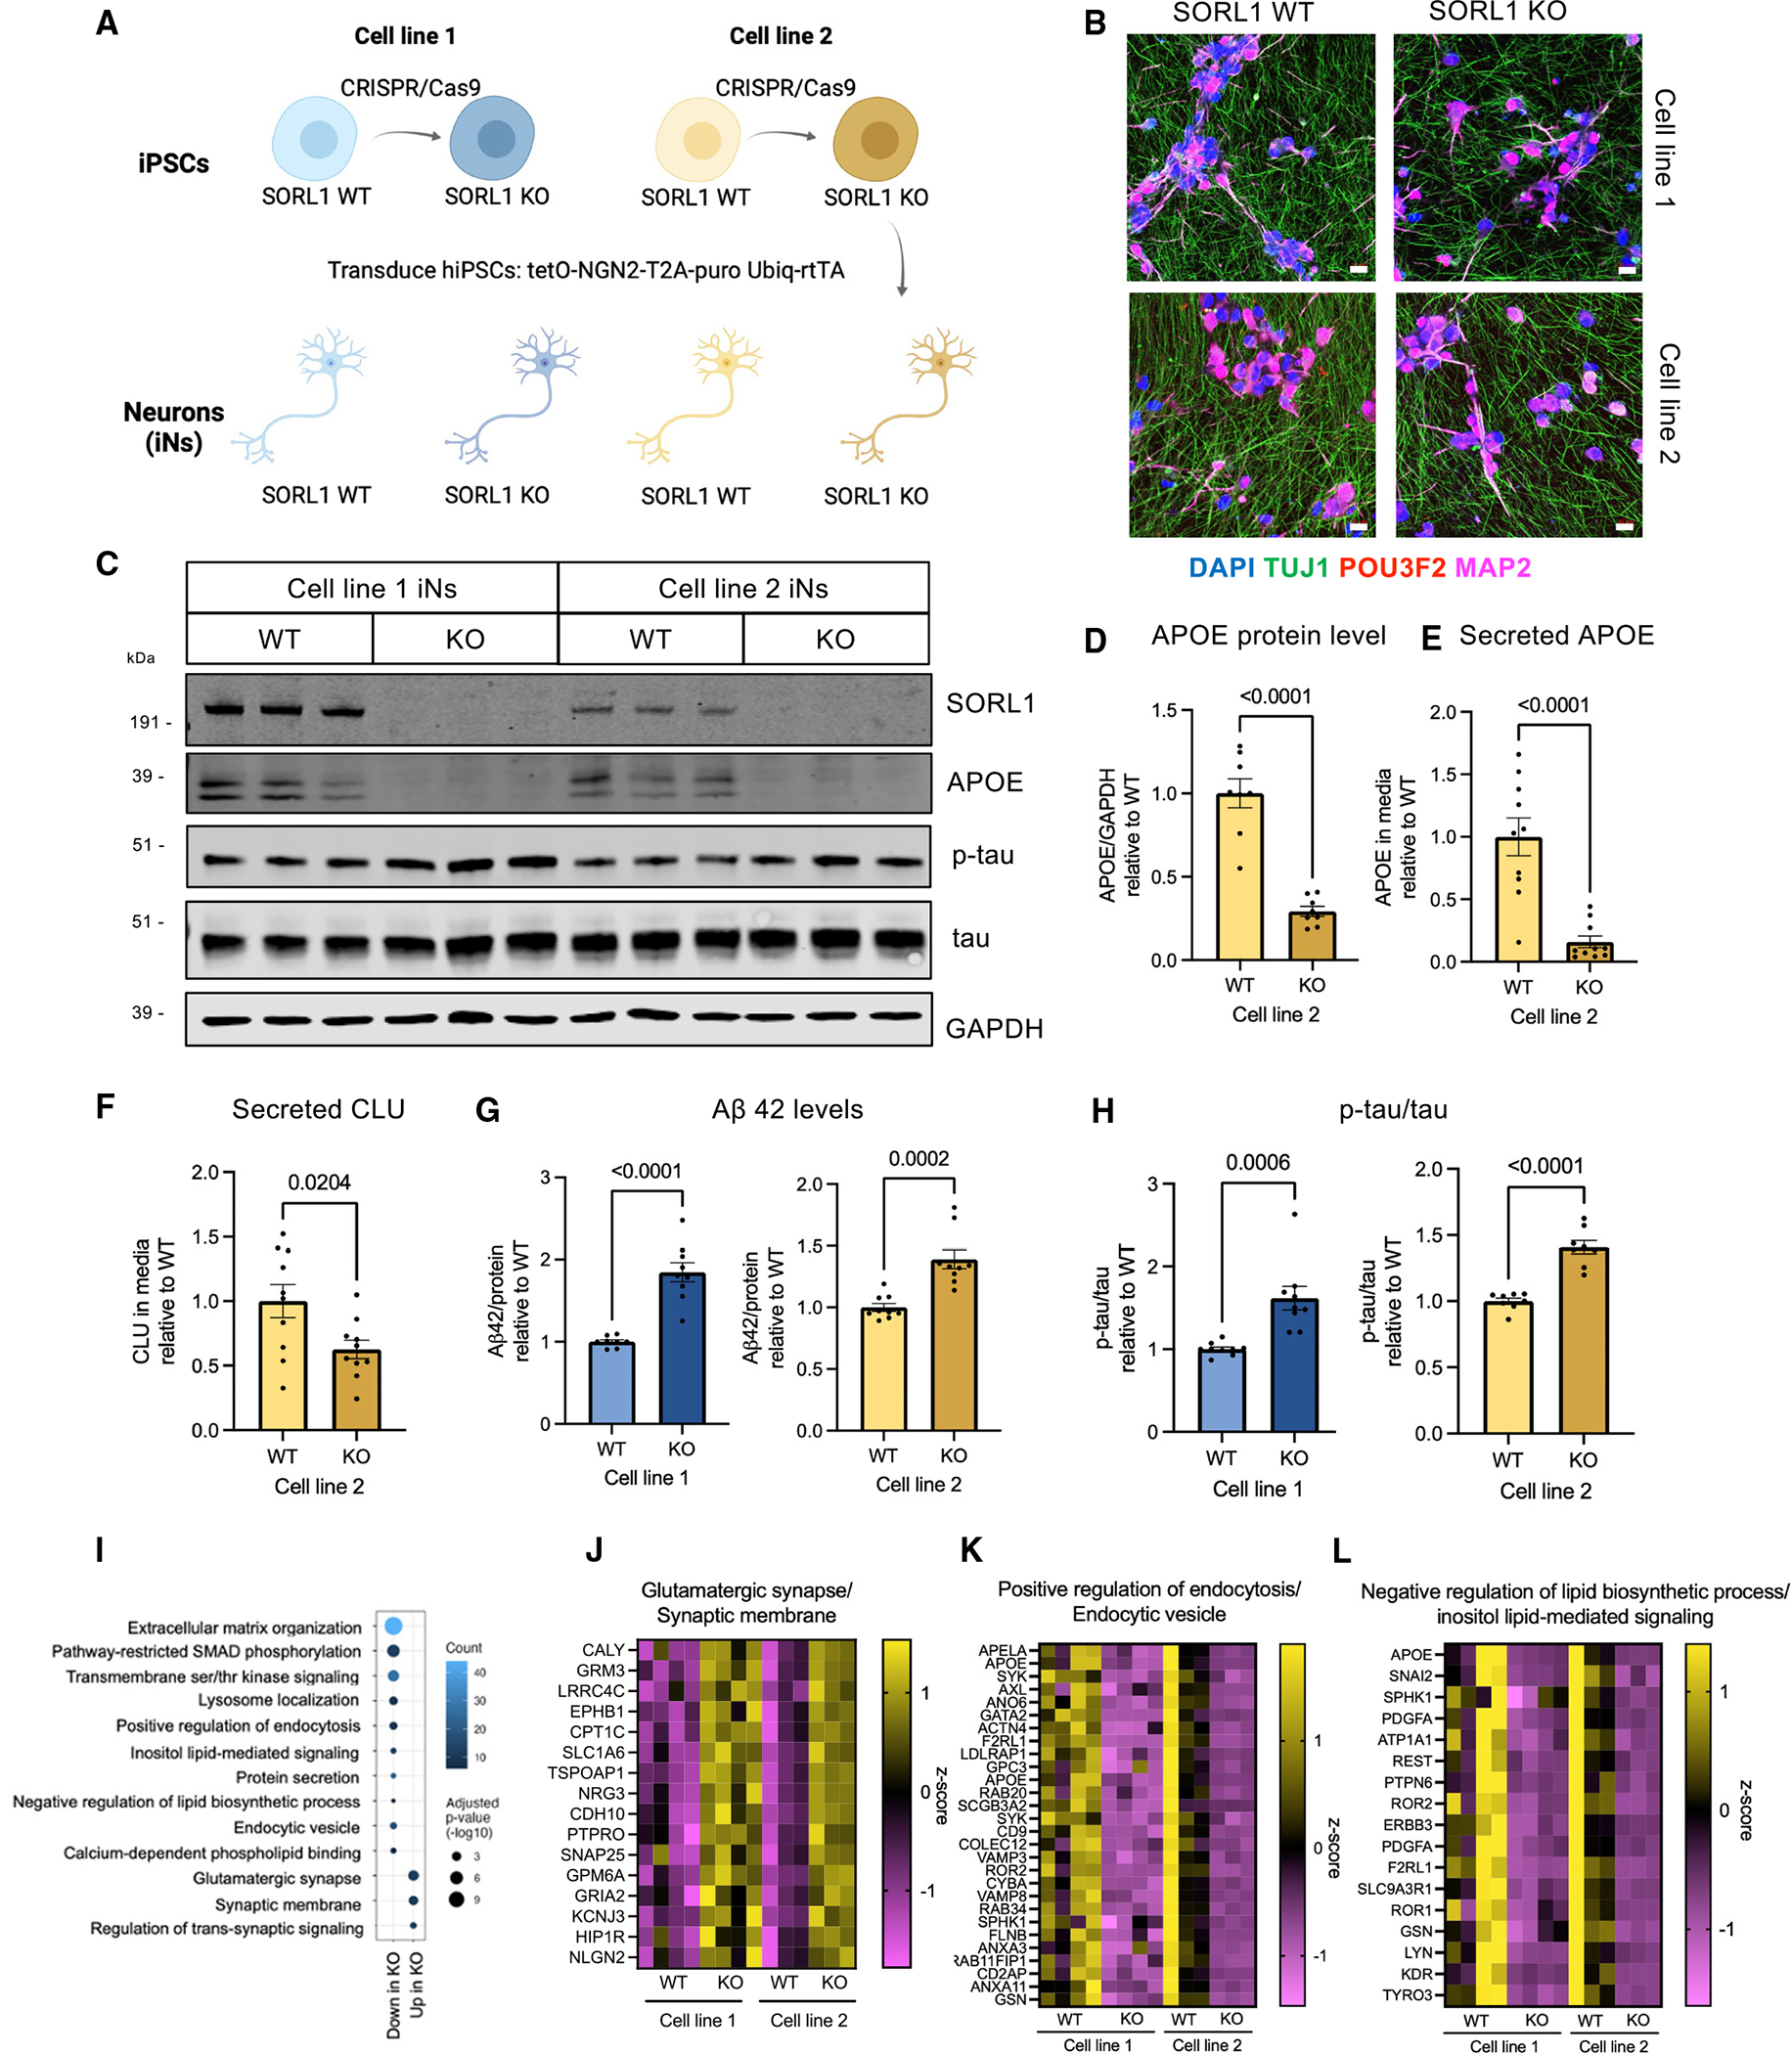
Figure 2. SORL1 KO neurons express elevated Aβ and increased phosphorylation of tau.

(A) Overview of the experimental design to generate SORL1 KO neurons. SORL1 KO iPSCs were generated using CRISPR-Cas9 and were differentiated into neurons using induced expression of NGN2.
(B) Representative immunocytochemistry images of D21 iNs showing the expression of neuronal markers. Scale bars, 20 μm.
(C) Representative western blot of iN D21 protein lysates from line 1 and line 2.
(D–F) Quantifications within cell line pair 2 of APOE/GAPDH in lysates (D), APOE in the media (E), and CLU in the media (F) normalized to total protein are shown.
(G) Aβ42 levels in the media normalized to protein concentration for cell line pairs 1 and 2.
(H) Quantification of p-tau (p202/205)/total tau ratio in iN D21 protein lysates from western blot data. SORL1 KO iNs from pairs 1 and 2 both show increased phosphorylation of tau. Data in (D)–(H) show mean ± SEM from three independent differentiations. Within each round of differentiation, three wells were included for each group. Values are normalized to WT within paired lines. Unpaired Student’s t test (two tailed), p values are shown.
(I) Dot plot of molecular pathway over-representation in up- or downregulated DEGs in both lines 1 and 2. All pathway enrichments have an adjusted p value <0.05).
(J–L) Heatmap of a subset of genes that are differentially expressed in SORL1 WT vs. KO iNs and their relative expression levels (Z score) from selected GO terms in (I). Full datasets can be found in Table S2.
