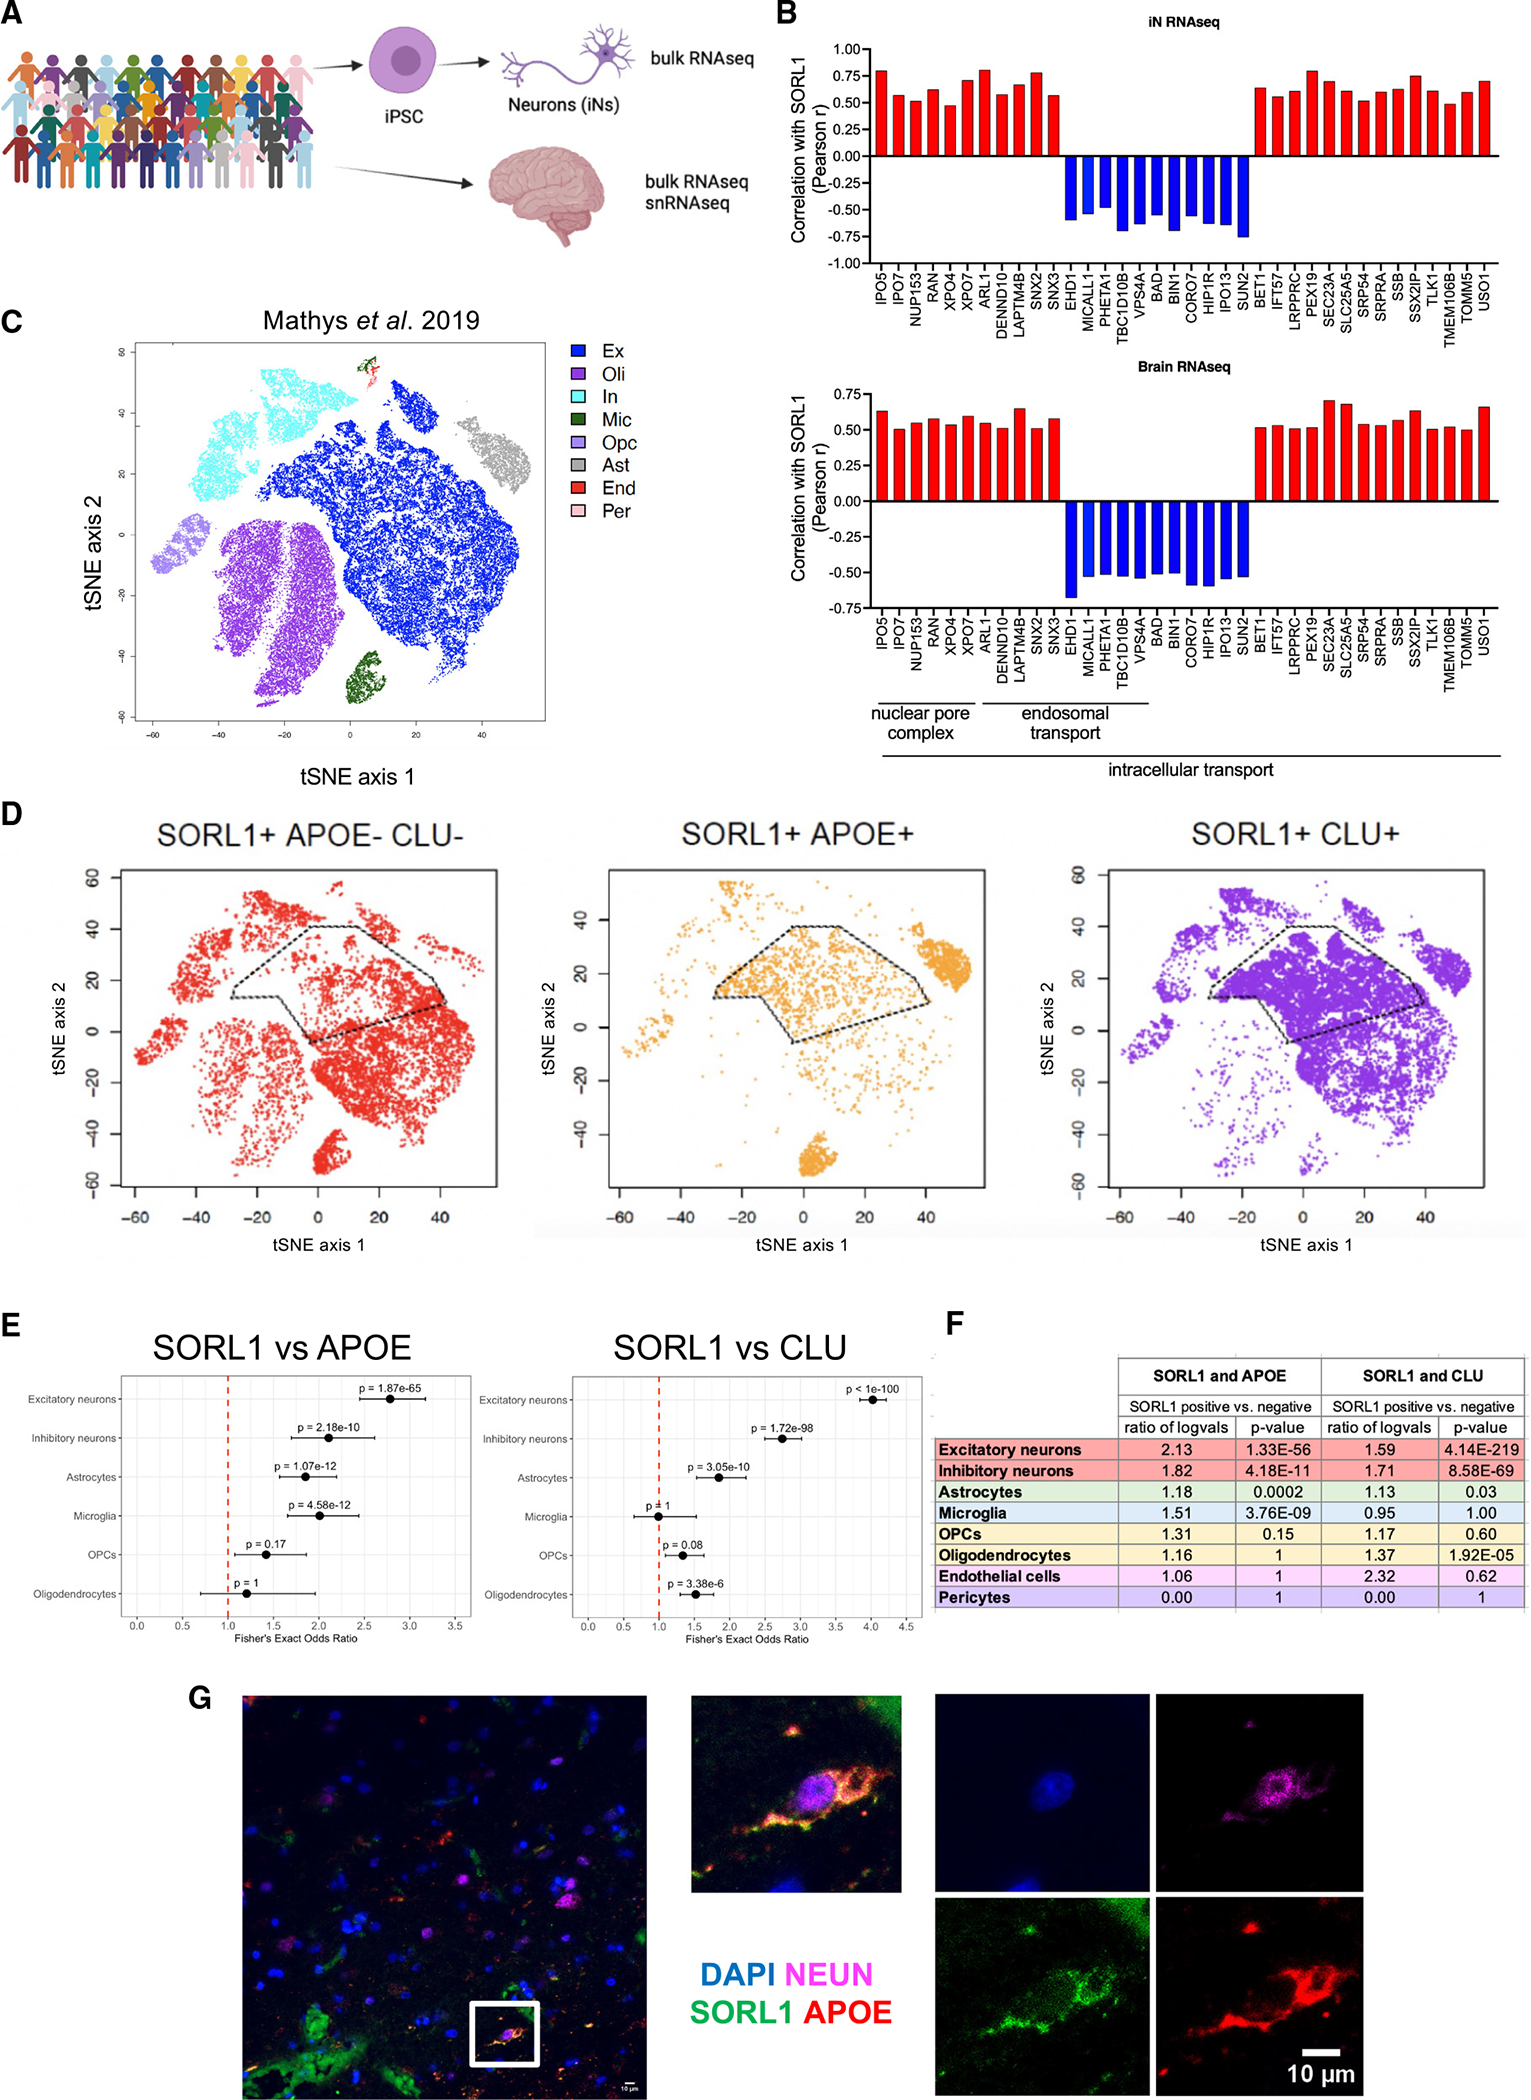
Figure 6. snRNA-seq of postmortem brain tissue validates an association between SORL1 and both APOE and CLU in excitatory neurons.

(A) iN bulk RNA-seq and postmortem brain bulk RNA-seq as well as snRNA-seq dataset (medial frontal cortex) were generated from the ROSMAP cohort.
(B) Correlation coefficient values (Pearson r) were calculated between SORL1 and other genes in bulk RNA-seq data from iNs and brain tissue. Shown are examples of concordant associations of SORL1 with genes in intracellular transport, endosomal transport, and nuclear pore complex gene sets within both iN and brain RNA-seq datasets.
(C) TSNE plot of snRNA-seq data derived from the ROSMAP cohort, colored by cell type, as determined by marker expression (data from Mathys et al.44). Data are from 70,634 cells from 48 individuals.
(D) TSNE plots with cells colored by SORL1, APOE, and/or CLU detection, as labeled. A high degree of overlap is observed between SORL1 expression and APOE and CLU expression in a subset of excitatory neurons, as well as in microglia and astrocytes.
(E) Fisher’s exact test results (adjusted p value and odds ratio) for the detection overlap of SORL1, APOE, and CLU within nuclei, separated by cell type.
(F) Differential expression results of APOE and CLU between SORL1+ and SORL1− nuclei using a Wilcoxon rank-sum test, separated by cell type. See also Table S6.
(G) Representative immunocytochemistry image of human brain section showing co-localization of DAPI, NEUN, SORL1, and APOE in a subset of cells. Scale bars, 10 μm.
