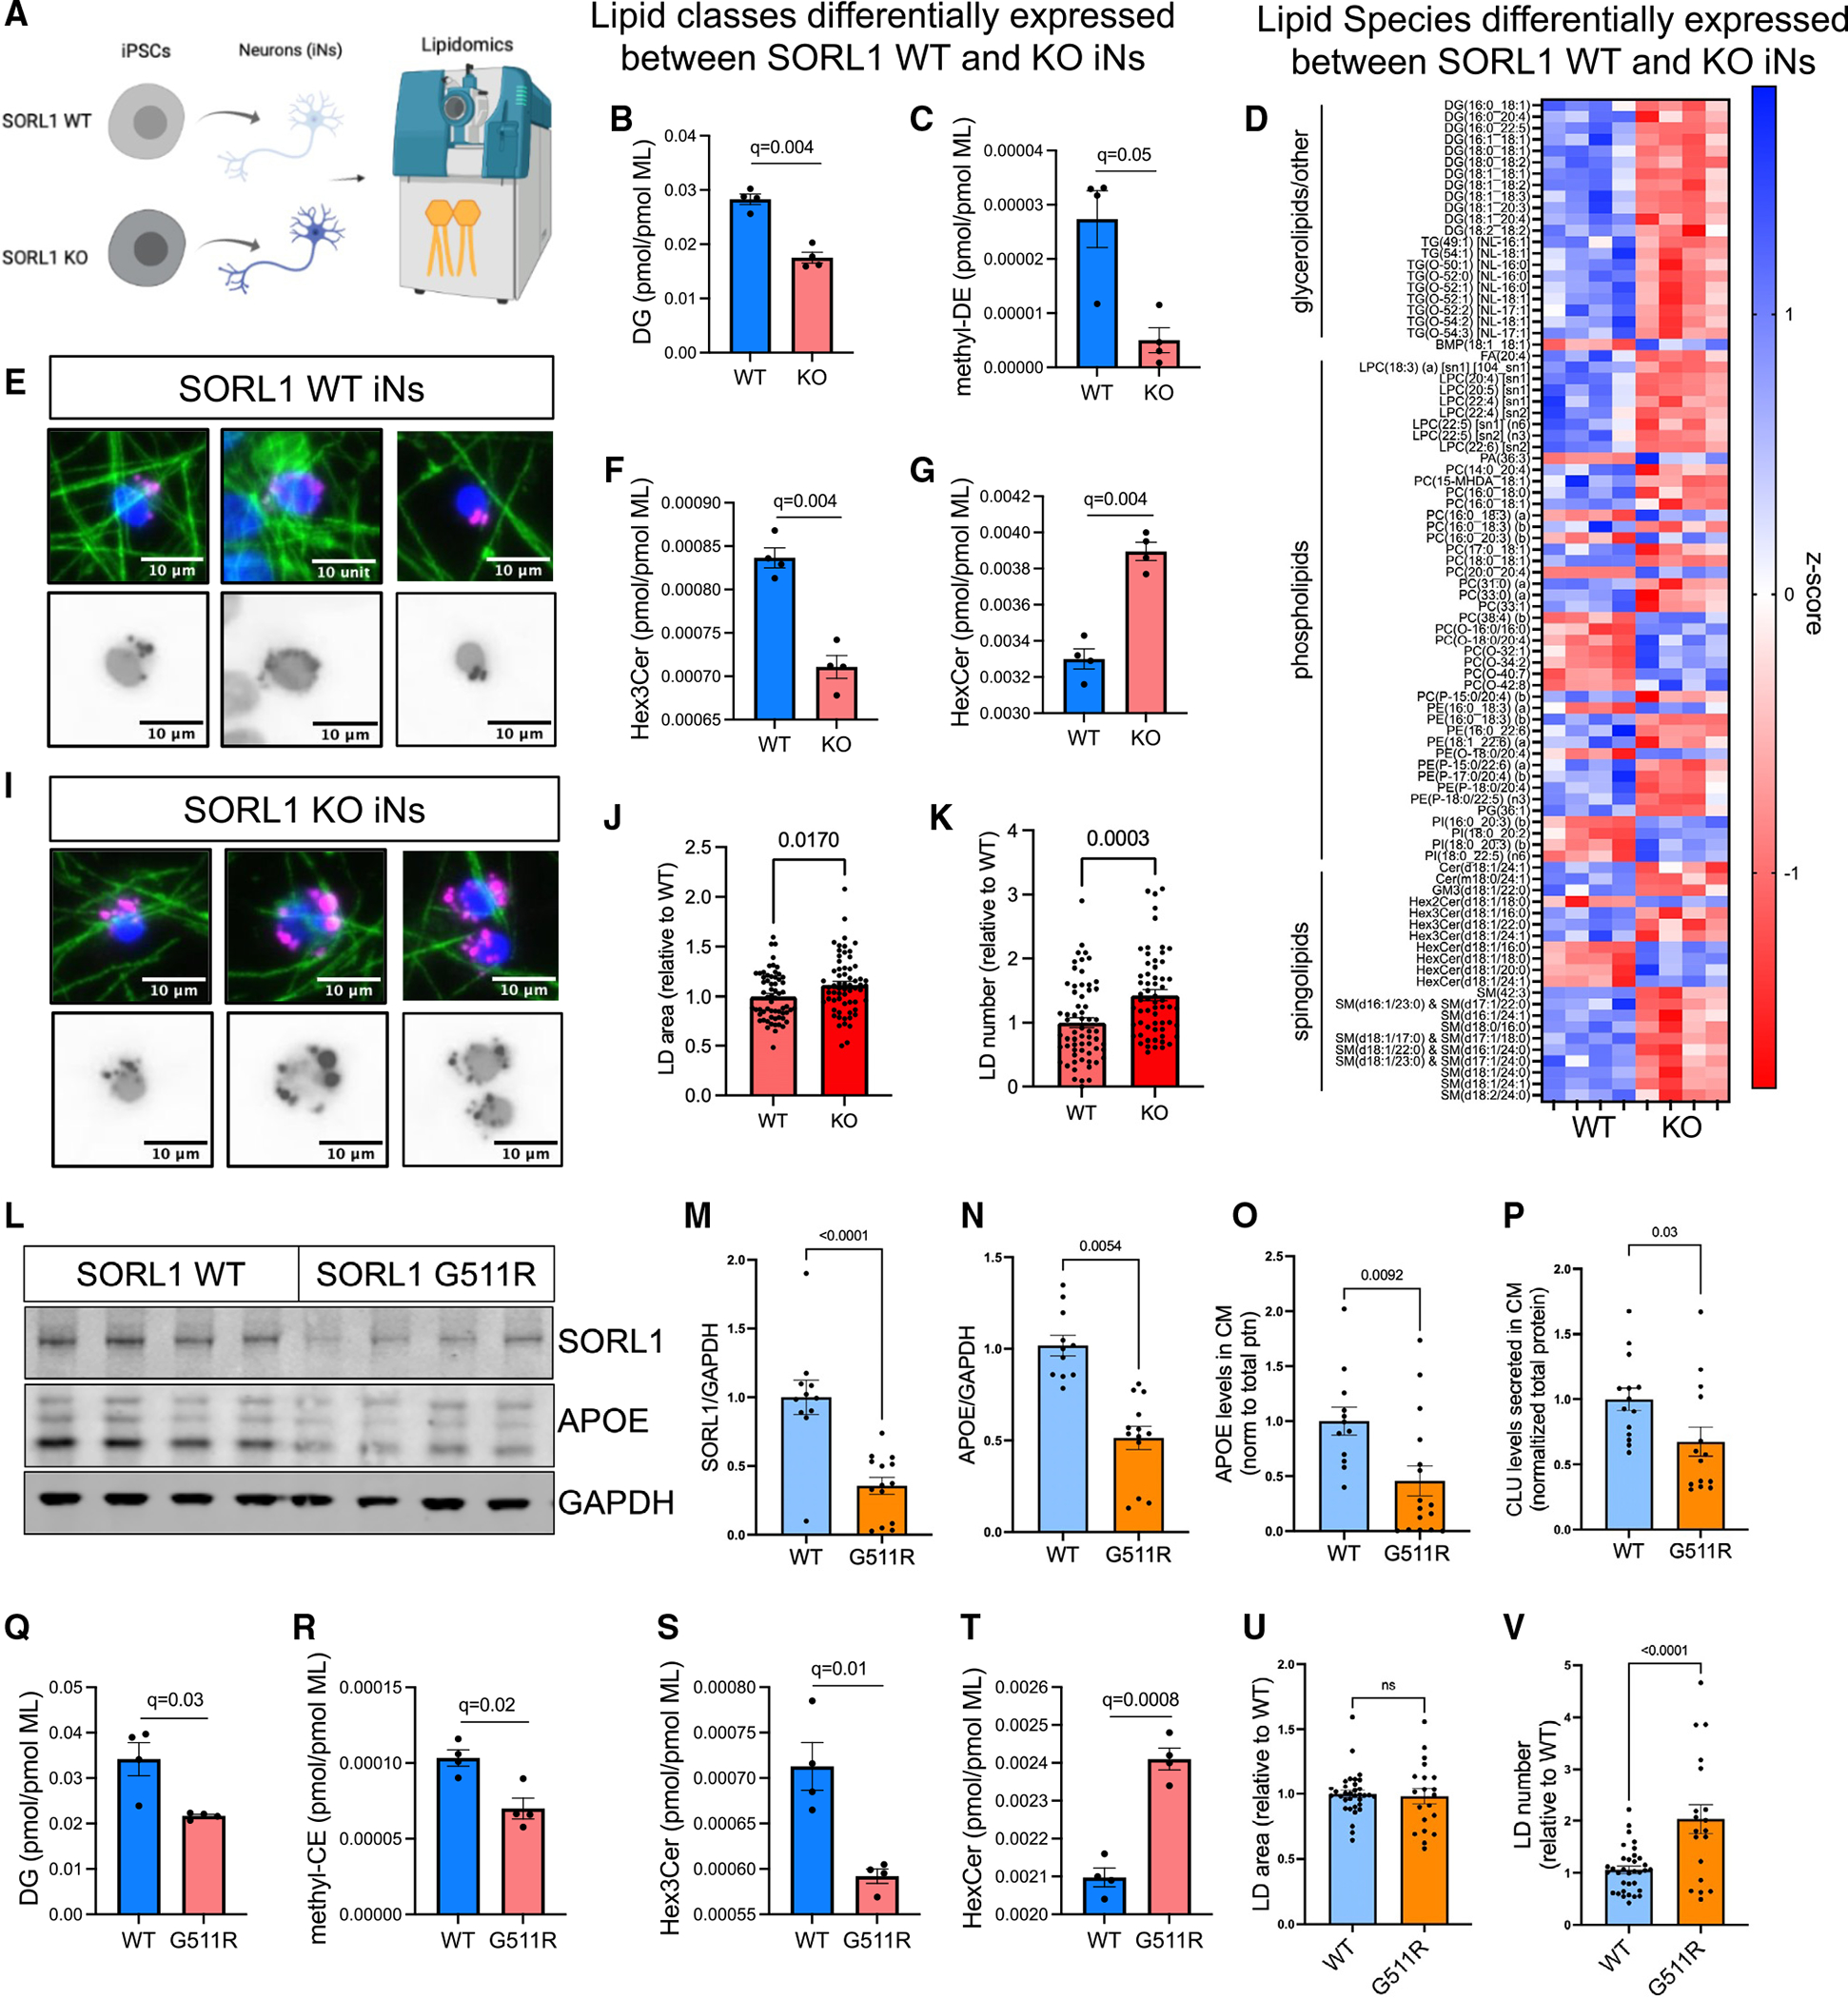
Figure 7. Dysregulation of lipid metabolism with SORL1 mutation.

(A) SORL1 WT and KO neurons were harvested for lipidomic analysis at D21, and 813 lipid species were quantified representing 47 different classes. Values for each species and class were normalized by total membrane lipid content within each sample to control for subtle differences in cell density and efficiency of lipid extraction. Then t tests were performed between WT and KO, with multiple comparisons testing using two-stage step-up (Benjamini-Hochberg), FDR 5%. Data showing four biological replicates.
(B, C, F, and G) Eight lipid classes show dysregulation in SORL1 KO iNs including diacylglycerol (DG, B), methyl-dehydrocholesteryl ester (me-DE, C), trihexosylceramide (“ex3Cer, F), and monohexosylceramide (HexCer, G). Data show mean ± SEM.
(D) Heatmap of Z scores of all lipid species that were dysregulated (q < 0.05).
(E and I–K) Representative images of LDs, stained using LipidSpot (E and I). Quantification of LD area (J) and LD number (K) per cell normalized to WT iNs. Data show mean ± SEM from three independent differentiations, three wells per differentiation.
(L–V) iNs derived from SORL1 G511R mutation iPSC lines45 and their isogenic WT paired iPSC line were analyzed. Representative WB (L) and quantification of SORL1 (M) and APOE (N) protein levels, normalized to GAPDH. Levels of APOE (O) and CLU (P) present in the media of the same cells were quantified via ELISA. Lipidomic analyses revealed 17 classes of lipids that were differentially present. Box and whisker plots (mean with error bars from minimum to maximum) of four of these classes are shown (Q–T). The complete datasets for all lipidomic analyses can be found in Table S7. Quantification of LD area (J) and LD number (K) per cell normalized to WT iNs. Data in (Q)–(T) show four biological replicates; data in (M)–(P), (U), and (V) show mean ± SEM from three independent differentiations, three or four replicates per group.
