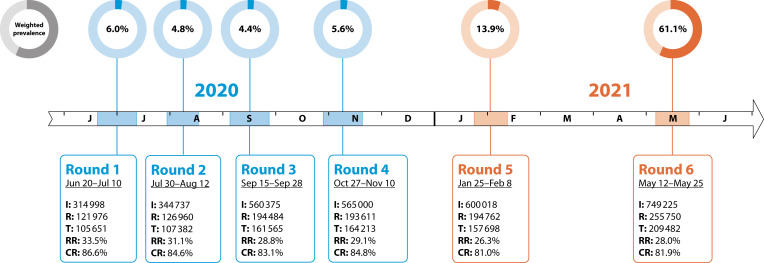
FIGURE 1—
REACT-2 Study Timeline From June 20, 2020, to May 25, 2021, Over 6 Rounds of Data Collection: England
Note. CR = completion rate (tests/registrations); I = invitations sent; R = registrations; RR = response rate (tests/invitations); T = lateral flow immunoassay tests completed. CR is defined by the number of completed tests over the number of kits sent out and the prevalence of antibody positivity, adjusted for test characteristics and weighted to England’s adult population. Note the reported response rates are conservative because (1) not all invitations would have been received (or opened) by the potential participants, and (2) recruitment was stopped once the required sample size had been reached.

