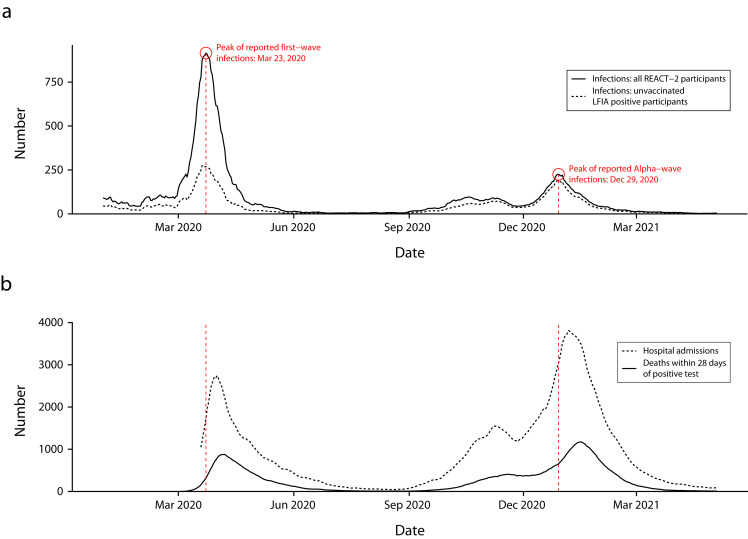
FIGURE 4—
Reconstruction of COVID-19 Pandemic Curve by (a) Week of Symptom Onset Reported by REACT-2 Participants, Alongside (b) National Data on Admissions and Deaths From COVID-19: England, June 20, 2020–May 25, 2021
Note. LFIA = lateral flow immunoassay; REACT-2 = REal-time Assessment of Community Transmission-2. In part a, the solid line includes date of onset for all cases of COVID-19 reported by participants, and the dashed line is limited to those who had a positive LFIA test result in the REACT-2 study.

