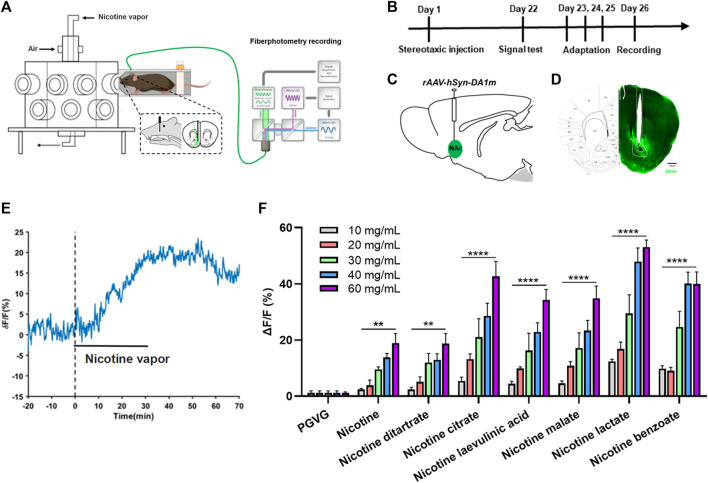
FIGURE 1.
Effects of nicotine salts on dopamine release in the nucleus accumbens (A) Experimental diagram. (B) Experimental timeline. (C) Schematic diagram of virus injection. (D) Representative graph of virus injection. Scale bar: 500 μM. (E) Representative curve of dopamine signal. (F) Average ΔF/F in different groups (two-way analysis of variance, concentration factor, F [7, 108] = 34.14, p < 0.0001; different nicotine salt factors, F [4, 108] = 62.51, p < 0.0001). **p < 0.01, ***p < 0.001, ****p < 0.0001. Data are shown as the mean ± standard error of the mean.

