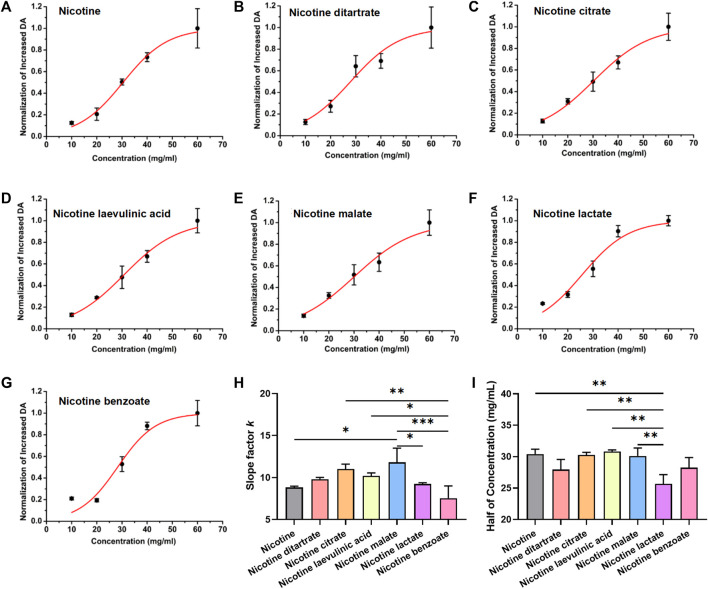
FIGURE 2.
Dose–response curve of dopamine signal changes and nicotine salts in the nucleus accumbens (A) Boltzmann fitting concentration effect curve of nicotine. (B) Boltzmann fitting concentration effect curve of nicotine ditartrate. (C) Boltzmann fitting concentration effect curve of nicotine citrate. (D) Boltzmann fitting concentration effect curve of nicotine levulinic acid. (E) Boltzmann fitting concentration effect curve of nicotine malate. (F) Boltzmann fitting concentration effect curve of nicotine lactate. (G) Boltzmann fitting concentration effect curve of nicotine benzoate. (H) Average slope factor in different group [n = 3, one-way analysis of variance (ANOVA), F [6, 14] = 7.61, p = 0.0009]. (I) Average half of concentration in different groups (n = 3, one-way ANOVA, F [6, 14] = 7.43, p = 0.001). **p < 0.01, ***p < 0.001, ****p < 0.0001. Data are shown as the mean ± standard error of the mean.

