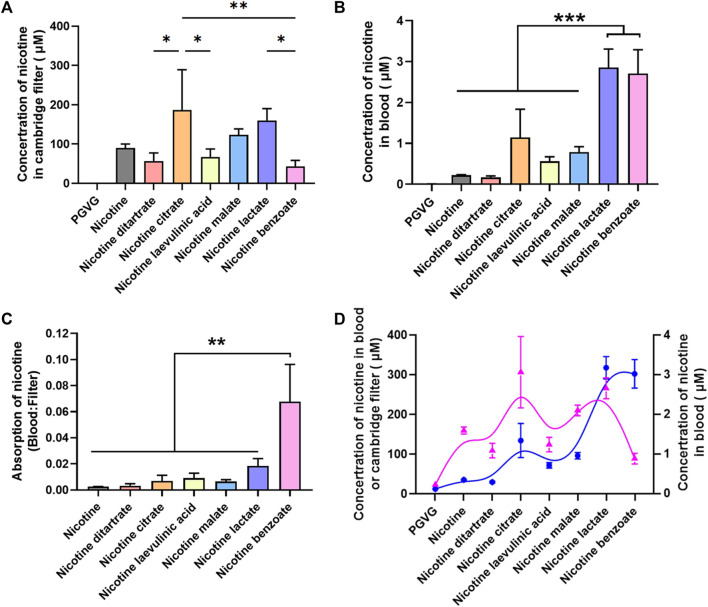
FIGURE 3.
Absorption efficiency among different nicotine salts (A) Average concentration of nicotine in Cambridge filter in different groups [n = 3, one-way analysis of variance (ANOVA), F [7, 16] = 7.27, p = 0.0005]. (B) Average concentration of nicotine in blood in different groups (n = 3, one-way ANOVA, F [7, 16] = 28.88, p < 0.0001). (C) Average absorption of nicotine in different groups (n = 3, one-way ANOVA, F [6, 14] = 12.75, p < 0.0001, p < 0.0001). (D) The Kendall rank correlation coefficient between Cambridge filters and blood [p-value Sig.(two-tailed) < 0.05]. *p < 0.05, **p < 0.01, ***p < 0.001. Data are shown as the mean ± standard error of the mean.

