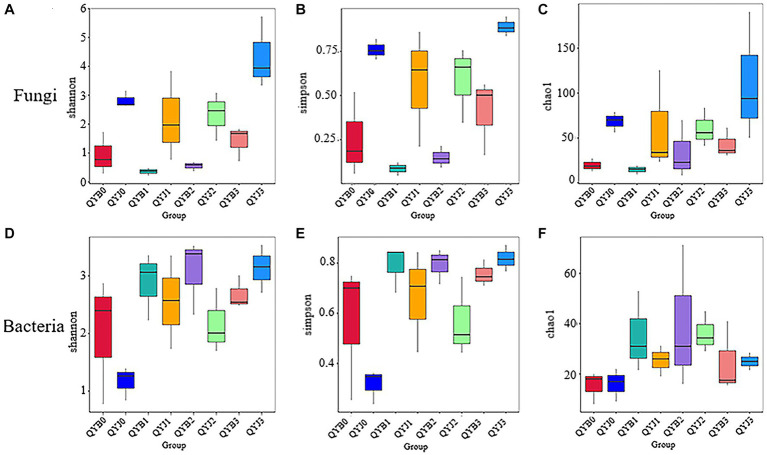
Figure 2.
Shannon (A), simpson (B), chao1 (C) Alpha diversity index of fungi in different leaf samples. Shannon (D), simpson (E), chao1 (F) Alpha diversity index in bacterial samples from different tobacco leaves (in the analysis of inter-group difference of Alpha diversity index, the box chart can directly reflect the median, dispersion, maximum, minimum and outlier values of species diversity within the group. At the same time, Tukey test was used to analyze whether the differences in species diversity between groups were significant).

