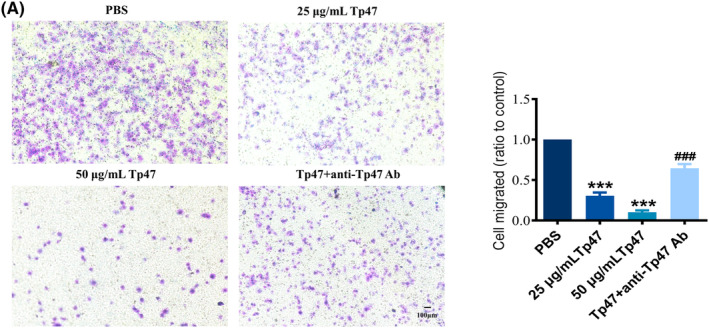
FIGURE 1.

(A) Tp47 impaired HMC3 cell migration. One‐way anova was used to compare three or more group means with one independent variable. All data were normalized to the PBS group and are presented as the means ± SD. *p versus PBS, ***p < 0.001. # p versus Tp47, ### p < 0.001. Scale bars = 100 μm. Abbreviations: anti‐Tp47 Ab, anti‐Tp47 antibody; PBS, phosphate‐buffered saline.
