FIGURE 2.

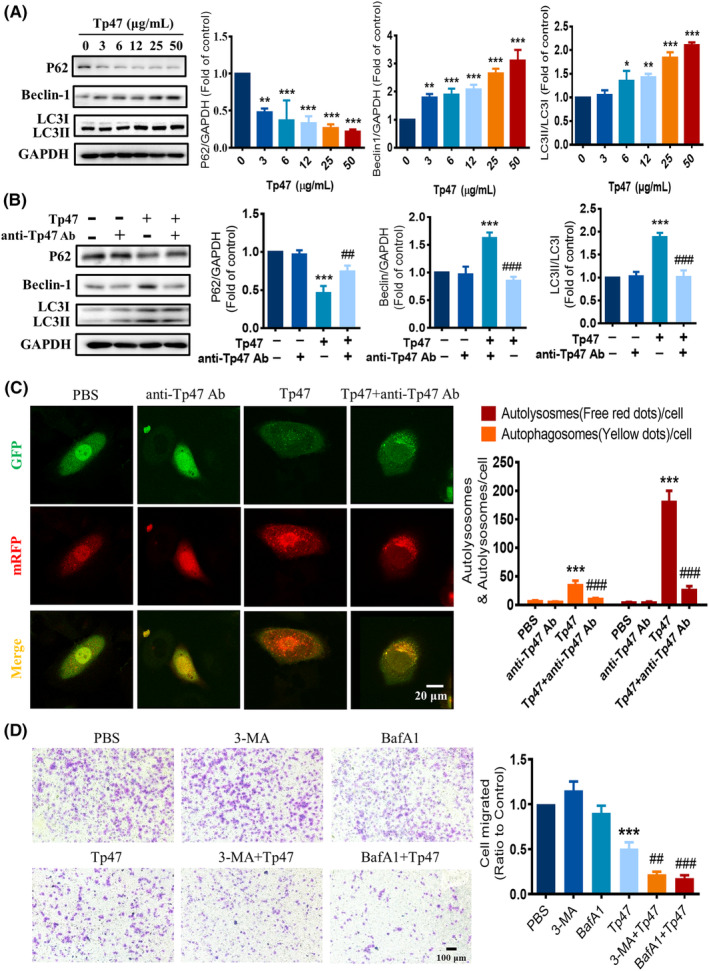
Tp47 induced autophagy to impair HMC3 cell migration. (A) The expression of autophagy‐related proteins in HMC3 cells treated with varying concentrations of Tp47. (B) The effect of an anti‐Tp47 antibody on the expression of autophagy‐related proteins. (C) The effect of an anti‐Tp47 antibody on autophagic flux. Scale bars = 20 μm. (D) The effect of the autophagy inhibitors 3‐MA and BafA1 on HMC3 cell migration. Scale bars = 100 μm. All data were normalized to the PBS group and are presented as the means ± SD. One‐way anova was utilized to compare multiple groups means with one independent variable. Two‐way anova was employed to compare multiple groups means with two independent variables. Post hoc comparisons were conducted using Tukey's t‐test. *p versus PBS, *p < 0.05, **p < 0.01 and ***p < 0.001. # p versus Tp47, ## p < 0.01, ### P < 0.001. Abbreviations: 3‐MA, 3‐methyladenine; anti‐Tp47 Ab, anti‐Tp47 antibody; BafA1, bafilomycin A1; PBS, phosphate‐buffered saline.
