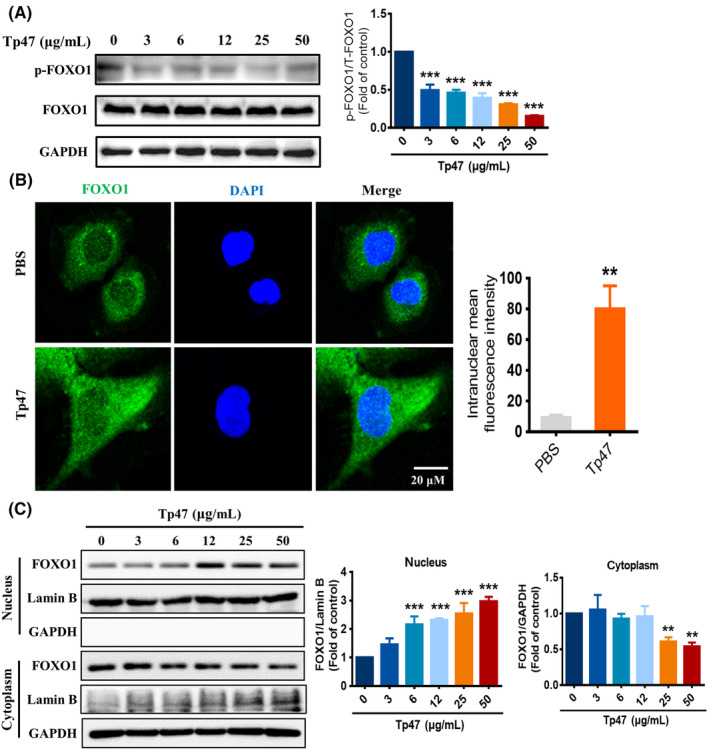
FIGURE 4.

Tp47 promoted FOXO1 transcriptional activation. (A) The effects of different concentrations of Tp47 on p‐FOXO1 protein expression. (B) Analysis of nuclear translocation of FOXO1 by immunofluorescence. Scale bar = 20 μm. (C) The expression levels of FOXO1 in cytoplasmic fractions and nuclear extracts determined by western blotting. All data are presented as the means ± SDs. One‐way anova was used to compare three or more group means with one independent variable. Student's t‐test was used to compare two groups. *p versus PBS, **p < 0.01, and ***p < 0.001. Abbreviations: PBS, phosphate‐buffered saline.
