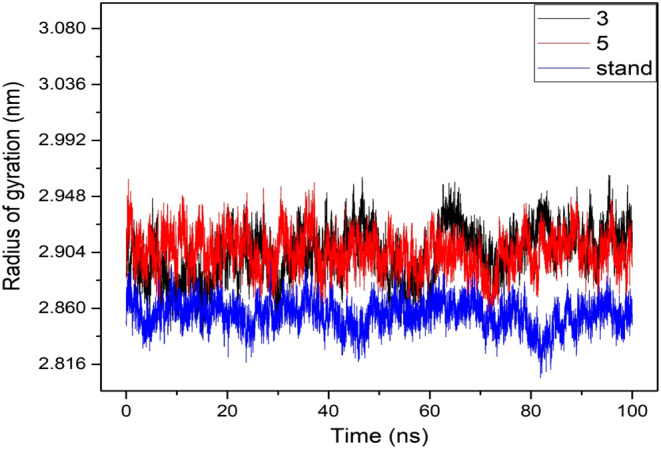
FIGURE 8.

The graphs show the radius of gyration (Rg) values for the three compounds in complex with the targeted receptor Apicoplast DNA Polymerase Enzyme (PDB ID: 7SXL) in 100 ns MDS assessments, where the selected two drug candidate compounds Ligand 03, Ligand 05 and the control drug in associated with the protein are exhibited by black, red and blue colour, respectively.
