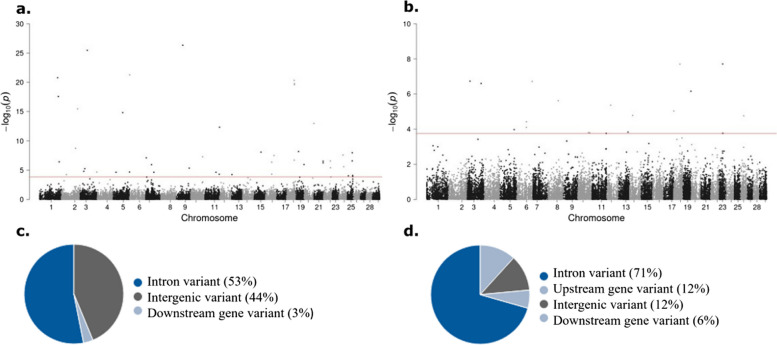
Fig. 2.
Manhattan plots of cis-eQTL mapping results. a cis-eQTLs identified in PB samples within 1 Mb upstream of a TSS. b cis-eQTLs identified in ICV samples within 1 Mb upstream of a TSS. The plot shows in the Y axis the –log10 (Pβ-values) of each SNP and in the X axis the chromosome where each cis-eQTL is located. Each dot represents a SNP along the Bos taurus genome. The dotted lines represent the Pβ-values that correspond to a FDR equal to 0.05. c, d The chart shows the genomic distributions of the PB (c) and ICV (d) cis-eQTLs identified within 1 Mb upstream of a TSS according to the Ensembl Variant Effector Predictor (VEP)

