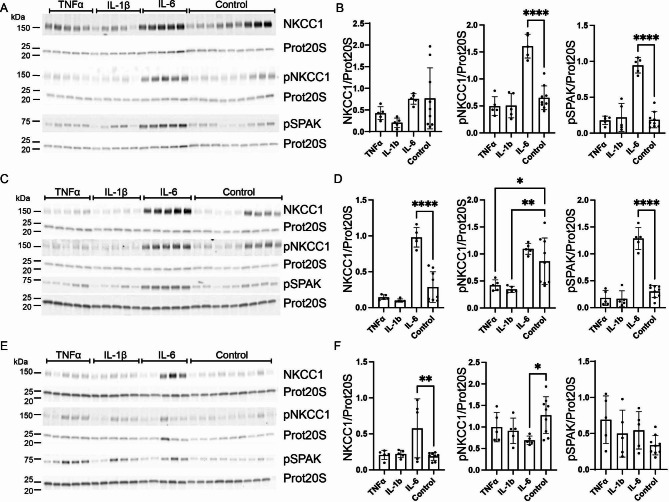
Fig. 6.
Effect of TNFα, IL-1β and IL-6 on CP expression of NKCC1, pNKCC1 and pSPAK. Primary culture cells were treated with either 100 ng/mL TNFα, IL-1β, or IL-6 for 24 h (A + B), 48 h (C + D) or 72 h (E + F). Cells were lysed and subjected to immunoblotting for NKCC1, pNKCC1 and pSPAK as well as proteasome 20 S (Prot20S) on the same membrane. Molecular masses (shown in kDa) are indicated on the left. The proteins were detected and densiometrically quantified. Bar graphs show expression of NKCC1 (left), pNKCC1 (middle) and pSPAK (right) relative to proteasome 20 S as mean ± SEM .*indicates p < 0.05, **p < 0.01, and ****p < 0.0001

