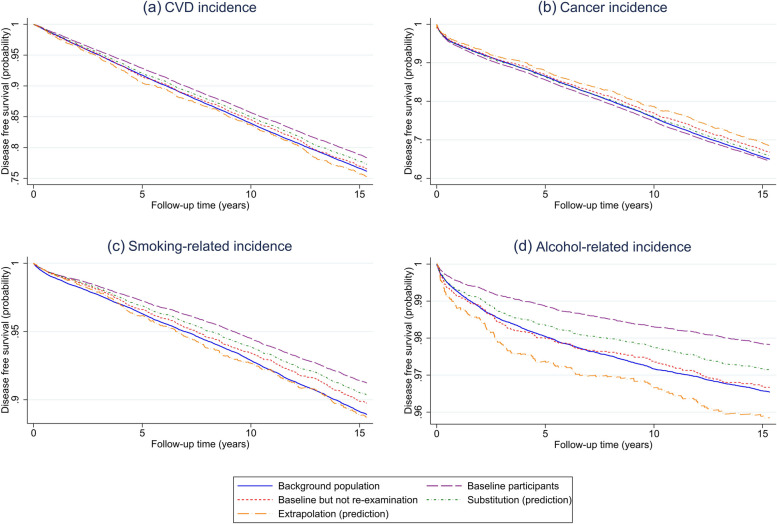
Fig. 3.
Kaplan–Meier (KM) curves for disease incidence showing the cumulative probability of disease-free survival among the full background population, the baseline participants, and the baseline participants not participating in the rescreening. The curves representing the substitution and extrapolation approaches aim to predict outcomes in the full background population. ICD codes for CVD, cancer, smoking-related, and alcohol-related events are provided in the Data section and in Supplementary Table S1. Note that, to enhance clarity, the range of the y-axis varies across the figures

