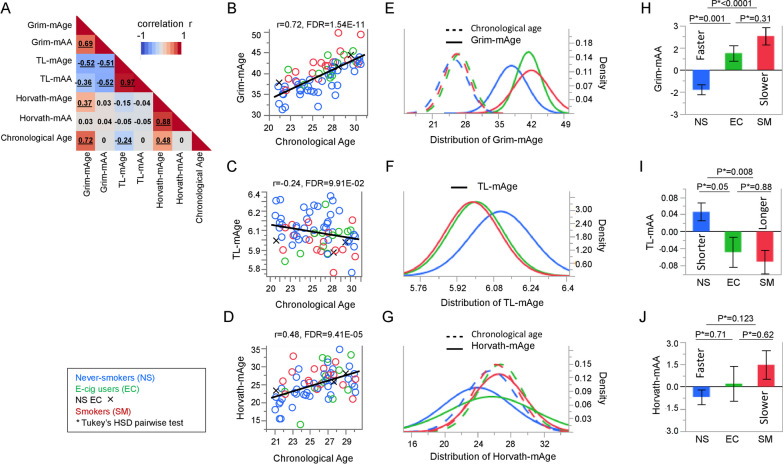
Fig. 1.
Correlations of between chronological age, methylation age (mAge), and accelerated mAge (mAA) estimates and associations with smoking and vaping status. A Pearson correlation plots displaying the associations between chronological age, mAge, and mAA measures. The scale bar displays the correlation coefficients (r) ranging from − 1 (blue) to 1 (red). B–D Correlation plots of associations between chronological age (x-axis) and mAge estimates (y-axis) for B Grim-mAge, C TL-mAge, and D Horvath-mAge. Each open dot represents individual never-smokers (NS, blue), electronic cigarette vapers (EC, green), and cigarette smokers (SM, red). Black X’s represent never-smoking EC (NS EC). B–D The line displayed reflects the linear regression line. E–G Plots with fitted normal curves displaying the age range (x-axis) and density of each given age value (y-axis). Each solid line represents the E Grim-mAge, F TL-mAge or G Horvath-mAge, for NS (blue), EC (green), or SM (red), while each dotted line represents chronological age for NS (blue), EC (green) or SM (red). Histograms of raw values (non-fitted) in Additional file 1: Fig. 1. H–J Bar charts comparing mean mAA estimates (y-axis) between NS (blue), EC (green), and SM (red) (x-axis) for H Grim-mAA, I TL-mAA, and J Horvath-mAA. Error bars display the standard error. P-values by Tukey’s HSD pairwise test are provided

