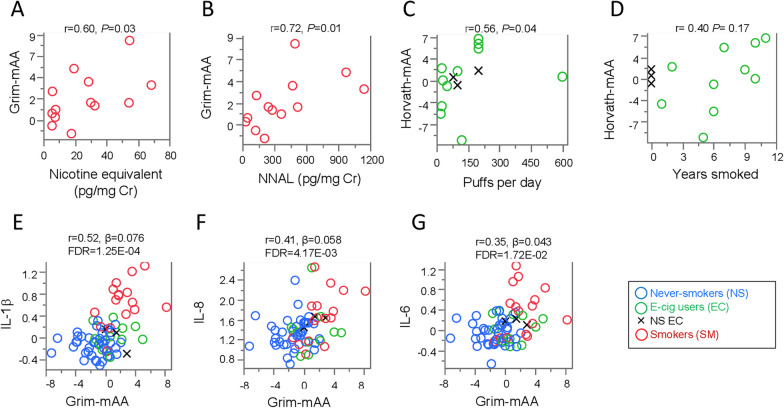
Fig. 2.
Relationships between Grim-mAA with urinary biomarkers, smoking indicators, and inflammatory biomarkers. Dot plots of correlations between A nicotine equivalent (Cotinine + 3-hydroxycotinine) and B NNAL (4-(methylnitrosamino)-1-(3-pyridyl)-1-butanol) with Grim-mAA (y-axis) among SM (red). Each open dot represents individual smokers. Dot plot of the correlation between C puffs per day (x-axis), D years smoked (x-axis), and Horvath-mAA (y-axis) among EC. Each open dot represents an individual electronic cigarette user. Black X’s represent never-smoking EC (NS EC). E–G Dot plots of associations between Grim-mAA (x-axis) and log10 transformed inflammatory cytokines (y-axis) displaying the partial correlation coefficient (r), effect size (β), and significant P value after adjusting for chronological age and gender including E IL-1β, F IL-8, and G IL-6. Each open dot represents an individual never-smoker (blue), electronic cigarette vaper (green) or cigarette smoker (red). Black X’s represent never-smoking EC

