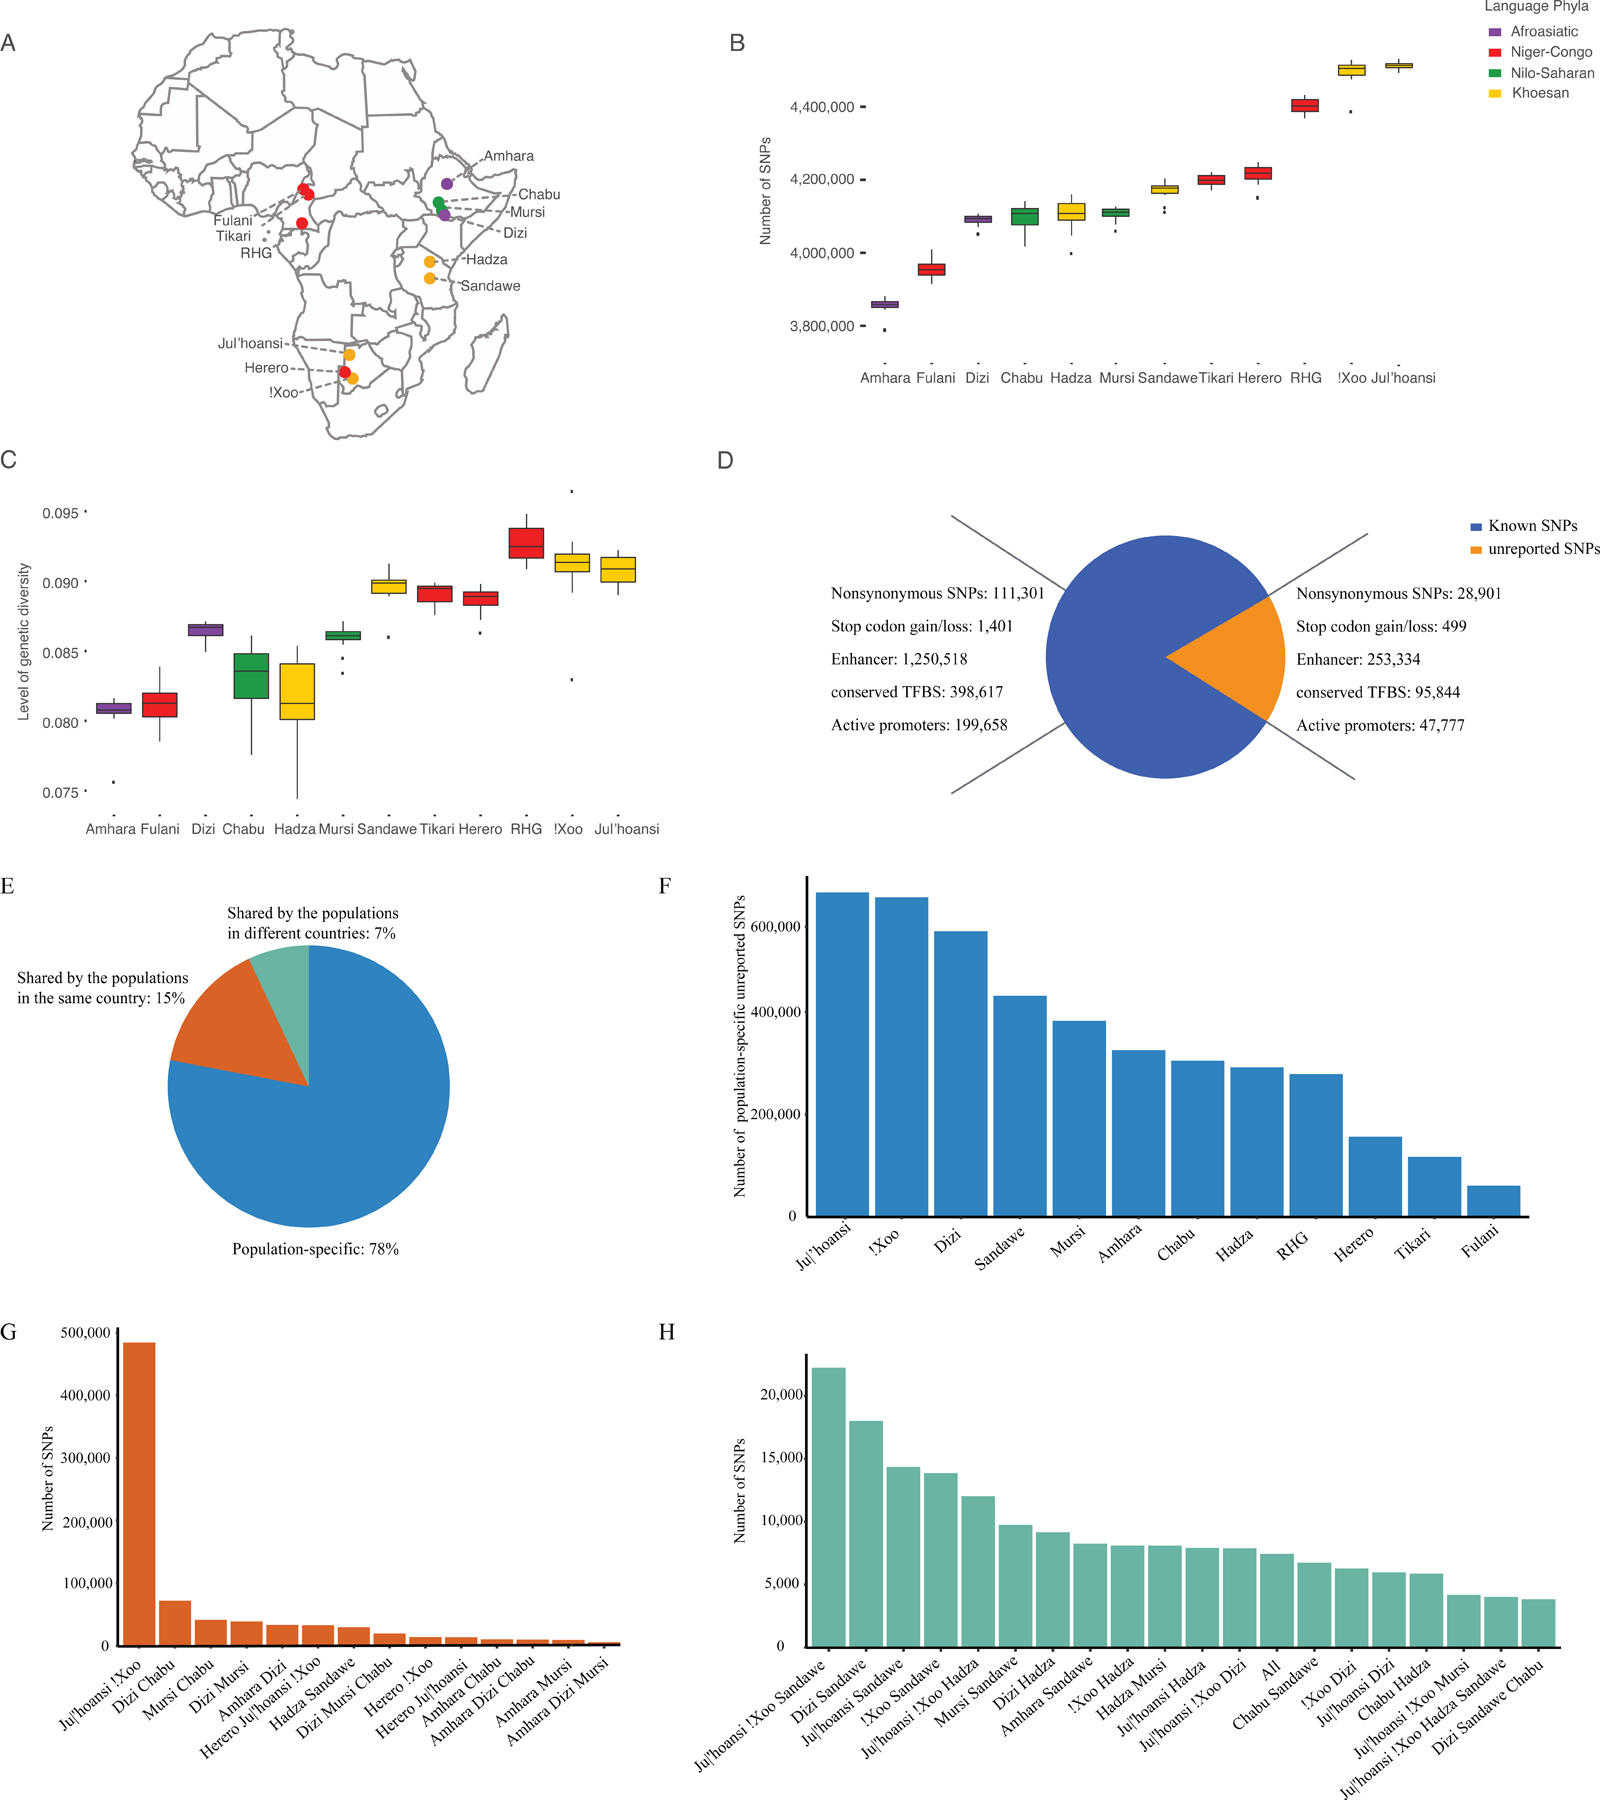
Figure 1. Geographic locations of the samples and summary of the variants identified in this study.

A: Points are populations, with color indicating language classification.
B: Number of SNPs across populations compared to the human reference genome (hg19).
C: Genetic diversity in terms of heterozygosity across populations.
D: Number of unreported and known SNPs and their potentially functional impacts. Here, unreported SNPs were identified by comparison to dbSNP100 (version 155) and gnomAD101 (version 2.1) databases. Annotations of regulatory elements were generated by the Encode project102 based on predicted chromatin state of lymphoblastoid cells from the “GM12878” sample as well as conserved transcription factor binding sites (TFBS). These annotations were downloaded from the UCSC genome browser website.103
E: Pattern of shared unreported SNPs in different populations.
F: Number of population-specific unreported SNPs in each population.
G: Number of unreported SNPs identified in populations in the same country.
H: Number of unreported SNPs identified in populations in different countries. “All” corresponds to SNPs that were shared by all 12 populations. RHG: rainforest hunter-gatherers.
