. 2023 Sep 19;15(39):16016–16029. doi: 10.1039/d3nr02874g

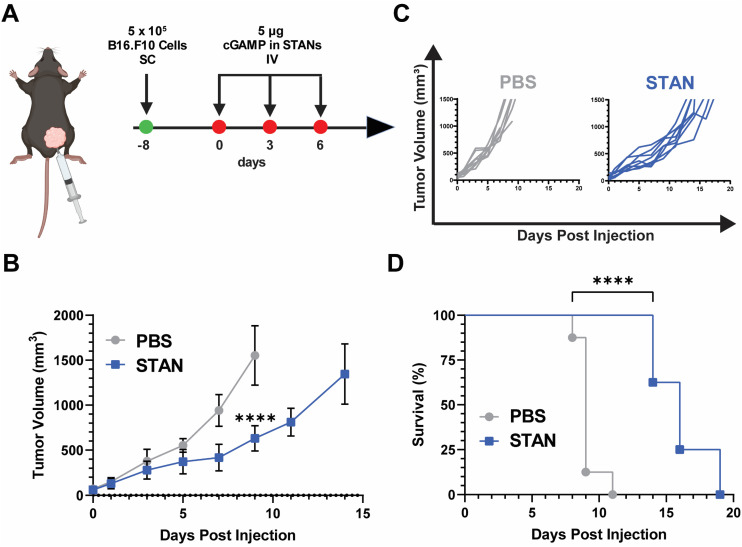
Fig. 5. In vivo efficacy of STANs formulated via FNP in a murine B16.F10 model of melanoma. (A) Treatment timeline of B16.F10 tumor model. (B) Mean tumor volume of mice treated with 5 μg of cGAMP within STANs plotted until the death of the first mouse within each group. Statistical analysis was performed on day 9 when the first mouse of any treatment group died (mean ± SEM, n = 6–8). Analyzed via Student's two-tailed t-test. ****P < 0.0001. (C) Corresponding spider curves of mice treated with PBS or STANs. (D) Kaplan–Meier survival curves of mice treated with PBS or STANs (n = 8). Analyzed via Mantel–Cox log-rank test. ****P < 0.0001.

Fig. 5