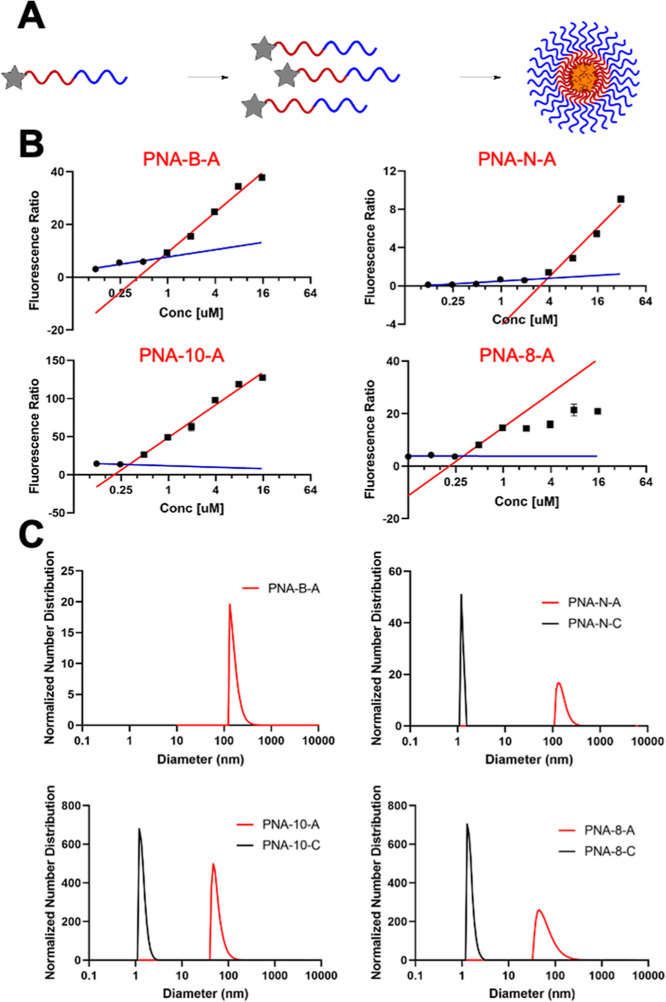
Figure 2.
(A) Activation of solvatochromic 4-DMN dye upon PNA assembly. (B) CMC measurement using the fluorescence ratio. The fluorescence ratio represents the PNA fluorescence relative to dye monomer fluorescence. Samples tested in water. The blue line represents the baseline of the curve. The red line represents the linear increase upon assembly. CMC is determined by the intersection of these two linear trends. (C) Normalized size distribution of PNA assemblies measured by DLS. Samples tested at 200 μM in 1× PBS.

