
Figure 7.
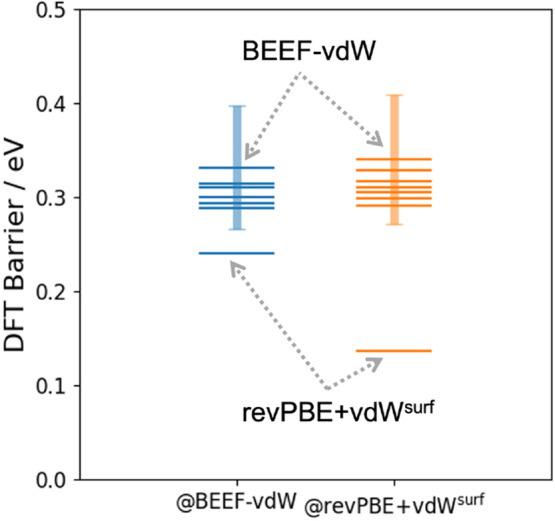
Density functional theory energy barriers obtained with single point calculations using different functionals and dispersion corrections at the BEEF-vdW and revPBE+vdWsurf initial and transition state geometries. In both cases, BEEF-vdW and revPBE+vdWsurf represent the upper and lower bounds of the estimated barrier, respectively, as indicated by the labels. Details for the other functionals are given in the main text and the SI. The shaded bar indicates the standard deviation of the BEEF ensemble uncertainty estimate.