Figure 2.
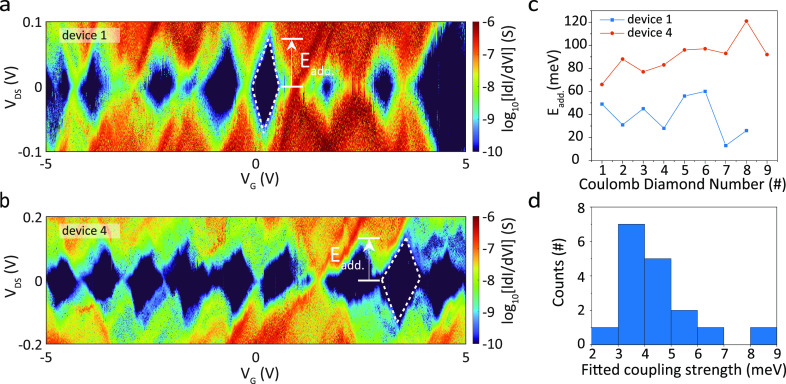
Quantum dot behavior at low temperature (9 K). Differential conductance dI/dV maps as a function of VDS and VG on a logarithmic scale recorded on (a) device 1 and (b) device 4. Dashed white lines guide the Coulomb diamond edges, and the height of the Coulomb diamonds are labeled as Eadd.. (c) Overview graphs of the corresponding Eadd. as a function of the Coulomb diamond number extracted from devices 1 and 4. (d) Histogram of the fitted coupling strength Γ of all 17 crossing points obtained from the Breit–Wigner (BW) model fittings.

